Divergence is one of the most effective and most common market conditions that provide reliable trading signals on the price reversal and market retracement depending on the divergence type.
The concept is simple, and that’s why it’s loved by traders all around the world. Divergence is a market condition when the price and the indicator diverge or go in different directions. The signal of the upcoming price movement
appears from this divergence.
The indicator is usually an oscillator placed below the price chart, so you can easily see divergence without applying any additional tools.
There are 4 types of divergences, BULLISH and BEARISH that can be either REGULAR or HIDDEN.
REGULAR BEARISH DIVERGENCE
The signify a reversal. After an extended uptrend, when price comes to an important resistance level, if there are bearish divergence, price is expected to reverse (no certainties). So price make a higher high and oscillator
makes a lower high. Confluence!


What is Regular Bearish Divergence?
The signify a reversal. After an extended uptrend, when price comes to an important resistance level, if there are bearish divergence, price is expected to reverse (no certainties). So price make a higher high and oscillator
makes a lower high. Confluence!
Price = higher high
Oscillator = lower high
The indicator signal means that the momentum is changing. Even though the price action has made higher highs, the uptrend may be weak. In this scenario, traders should get ready to go short, i.e., to sell the asset and repurchase
it later at a lower price.
REGULAR BULLISH DIVERGENCE
What is Regular Bullish Divergence?


What is Regular Bullish Divergence?
The signify a reversal. After an extended downtrend, when price comes to an important support level, if there are bullish divergence, price is expected to reverse (no certainites). So price make a lower low and oscillator
makes a higher low. Confluence!
Regular bullish divergence happens when the price action forms progressively lower lows while the indicator creates higher lows. The indicator action implies that the price needs to catch up with the indicator signal and
that the downtrend is weak. In this scenario, traders should get ready to go long, i.e., to buy the asset.
HIDDEN BULLISH DIVERGENCE
Price = higher low
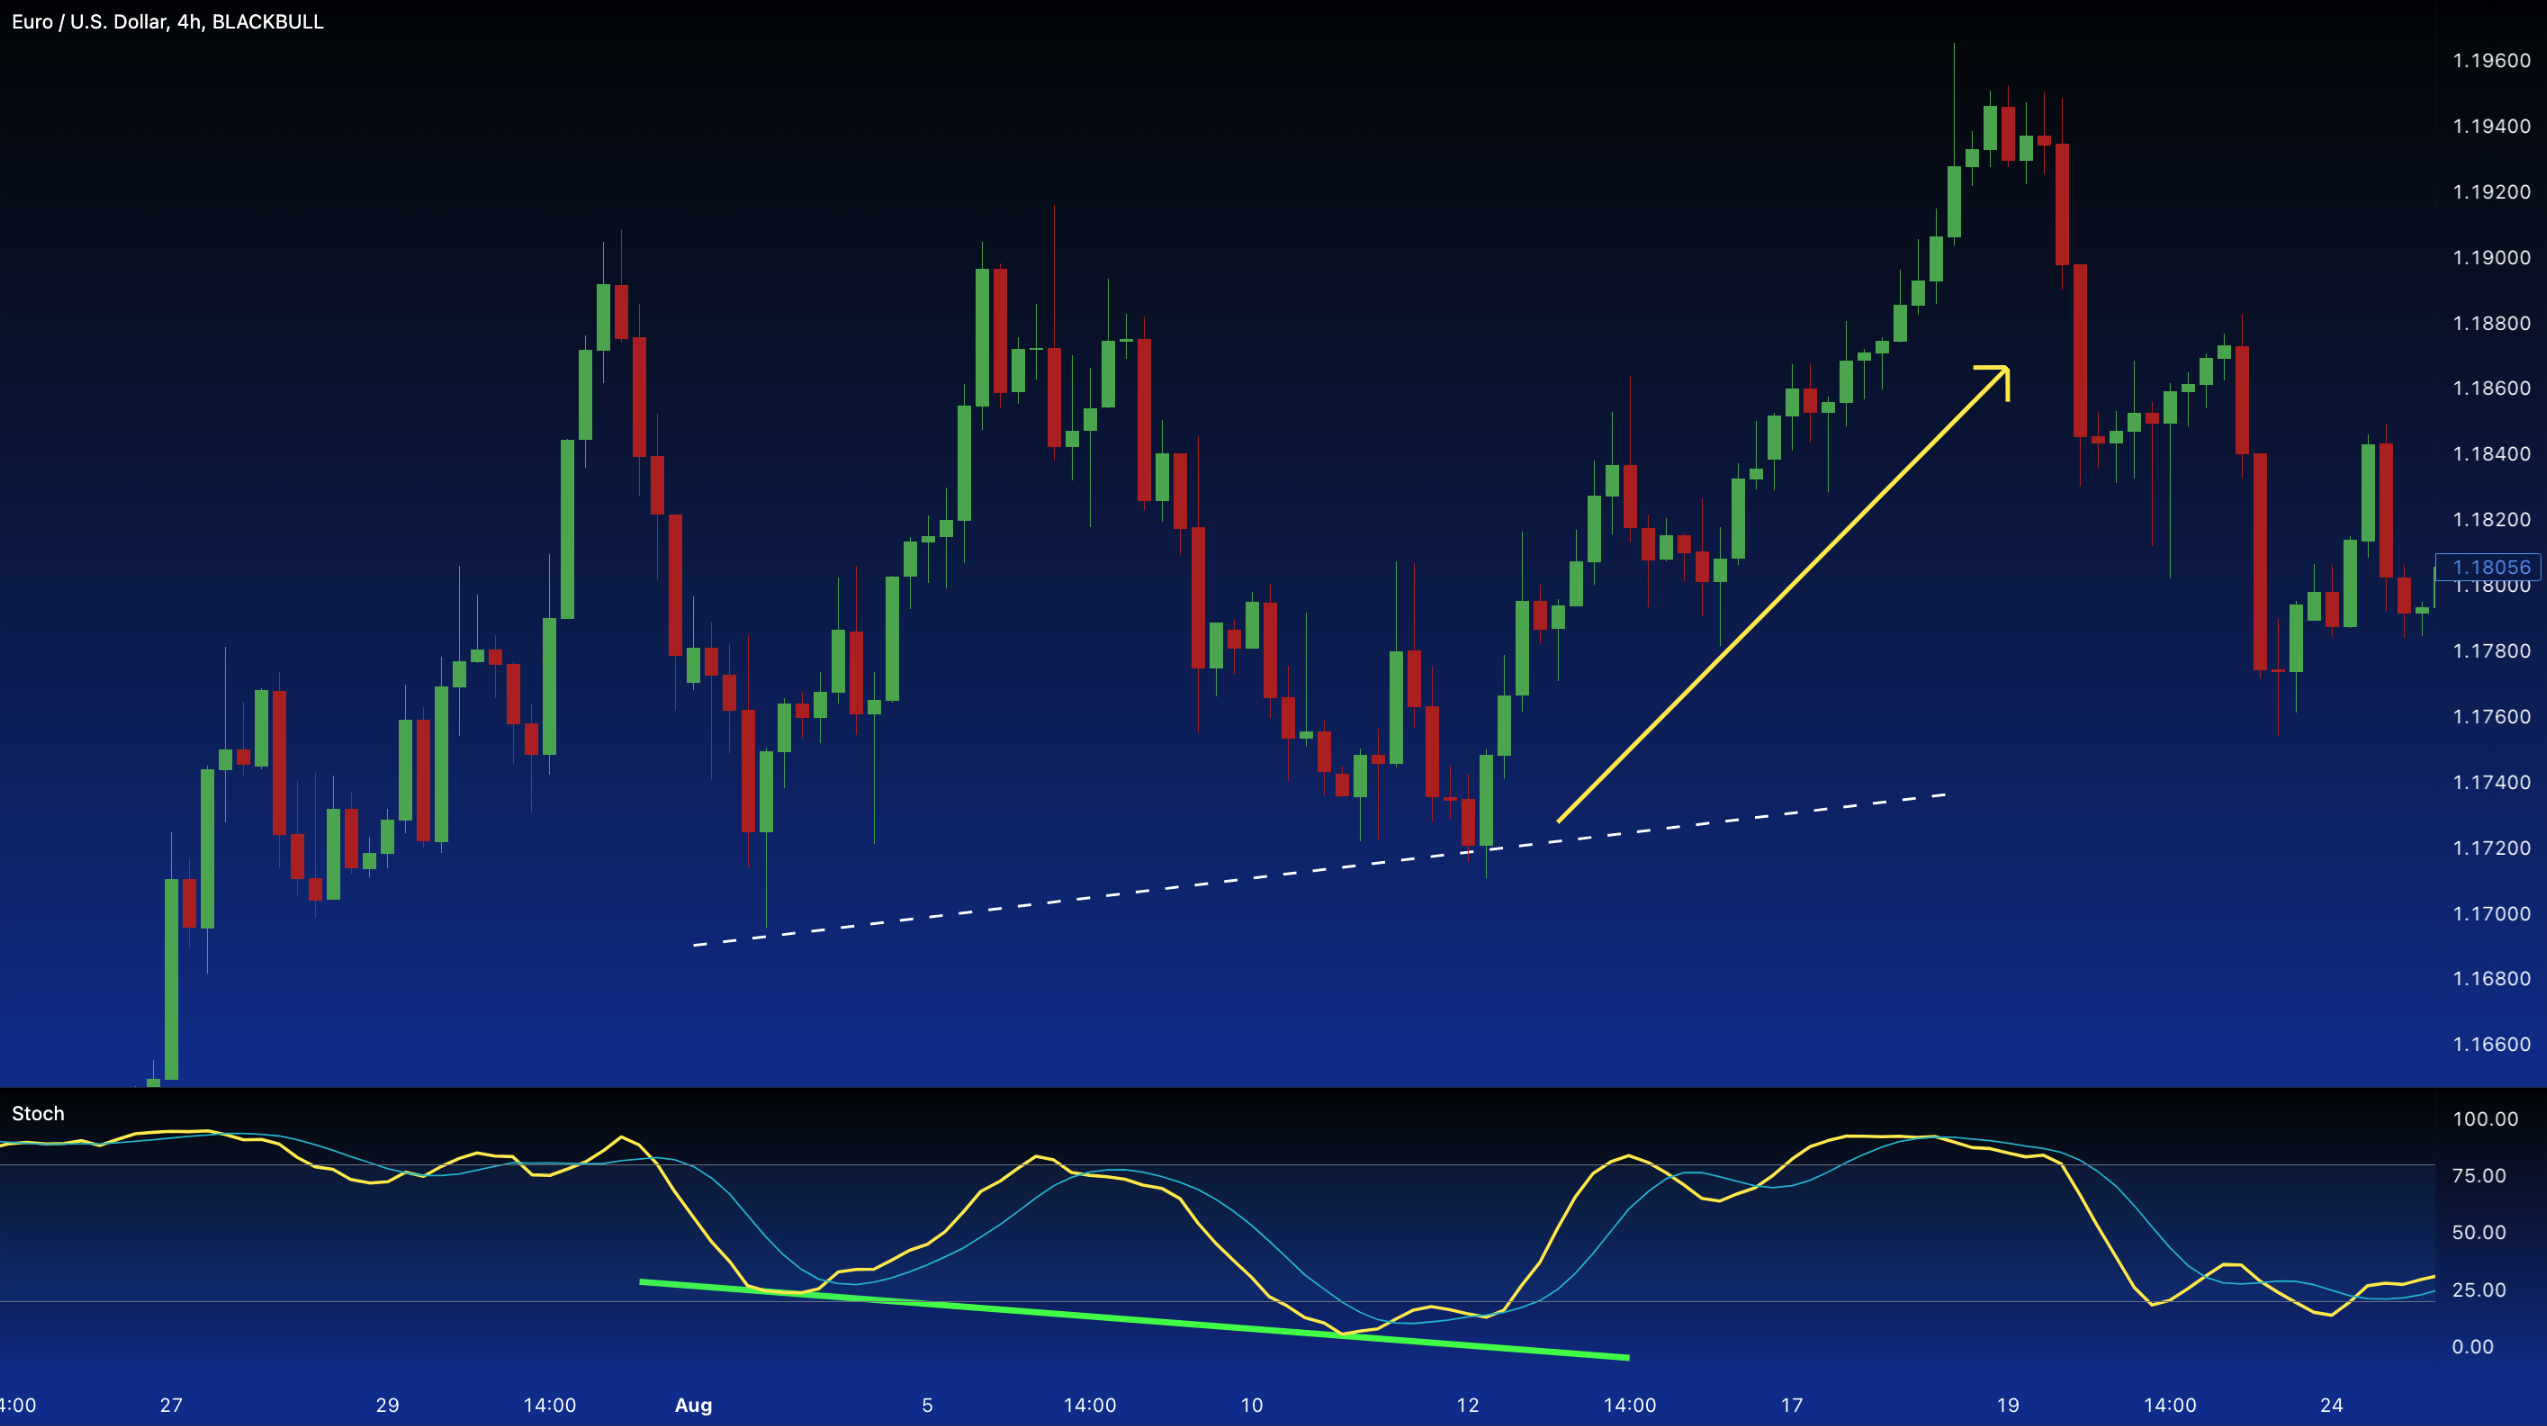
What’s a Hidden Bullish Divergence?
Divergences not only signal a potential trend reversal but can also be used as a possible sign for a trend continuation (price continues to move in its current direction). So HBD signifies continuation. When there are hidden bullish divergences in an uptrend, going onto a strong support there is a ‘buy the dip’ opportunity, Hidden bullish divergence happens when the price is making a higher low (HL), but the oscillator is showing a lower low (LL).
Price = higher low
Oscillator = lower low
HIDDEN BEARISH DIVERGENCE
Price = higher low

What’s a Hidden Bearish Divergence?
The hidden bearish divergence is pretty much the opposite of the hidden bullish div. and hence is a possible sign for a trend continuation (price continues to move in its current direction). When there are hidden bearish divergence, its used to stay out of a long trade and look for short entry, especially as it comes into a strong resistance level. Hidden bearish divergence happens when the price is making a lower high (LH), but the oscillator is showing a higher high (HH).
Price = higher low
Oscillator = lower low
PRACTICAL EXAMPLES
Bitcoin for weeks had a rising price in a form of a ascending wedge. Meanwhile we had a descending MACD signal along with the histogram confirming a bearish divergence as well.


Bitcoin for weeks had a rising price in a form of a ascending wedge. Meanwhile we had a descending MACD signal along with the histogram confirming a bearish divergence as well.
Bitcoin for weeks had a rising price in a form of a descending wedge. Meanwhile we had a ascending MACD signal along with the histograms confirming a bullish divergence in the making.
DIVERGENCE CLASS TYPES
Divergences have varying degrees and you will note the difference between the angles as well.

Divergences have varying degrees and you will note the difference between the angles as well.
CLASS A, B and C.
A good example of a bearish div. is a double top, price reaches the same level however the indicator shows a significant lower oscillator.
Recap:
A regular divergences are possible signals for trend reversals while hidden divergences signal trend continuation:
> Regular divergences = signal possible trend reversal
> Hidden divergences = signal possible trend continuation
In Summary:
Don’t expect too much of them as its impossible to know when the divergence plays out as the time frame also has a factor and the fact that the indicators are all lagging indicators.
I would say, a divergence is a bonus factor in a strategy, a tick in the box. It on its own is not reliable. Again, everything has context for it to be a reliable indicator. You will see why that you will get different results
when looking at different time frames.
Hence the trading strategy is most import. In other modules, divergences come into the strategy as a bonus factor and it doesn’t hold much weight without context
In addition, over time, you will note that in a bull market, in a bullish uptrend, bearish divergences tend to be unreliable and fail often. However when they do play out, its usually too late and will only be confirmation after
the fact. Similarly you will note in a bearish market, in a down trend, bullish divergences are also un-reliable, until they play out.
Many samples of divergence charts on discord channel:
https://discord.com/channels/692265636763664455/707145931040227379