COVID strikes again – Forecast #41
Dear subscribers,
My last letter was bullish with high conviction with price at $58.2k, since then price has collapsed to $54.8k as BTC got pulled down in a risk-off environment lead by stocks fearing the new COVID variant discovered in South Africa.
In this letter I’ll cover the on-chain structure and compare this with the COVID crash of 2020 and also the May mini bear market crash.
Top level summary for 27th Nov 2021 (current price $54.8k):
> Macro: Unchanged (as per last letters), structurally we expect a bull run well into Q1 2022.
> Short term: HODLers continue to buy the dip, there are no signs of fundamental weakness seen in the COVID 2020 and May 2021 crashes. Short term trader positioning is currently signalling a bottom. In essence the last call for a bottom remains unchanged apart from an unpredictable down wick from COVID macro fears. (I will issue a new letter should this change and investors start selling.)
Ethereum notes: ETH fundamentals remain strong.
BTC price action expectation: A clear bottom forming in the next 2-4 days. Then consolidation over the weeks of December, and if nothing else changes a bullish phase in January.
Price action conviction: Medium to high.
All the best until the next letter.
-W
=======================
Where to buy BTC…my FTX referral >
link
It’s that part of the cycle again where I’m being asked where’s the best place to buy BTC…
I use FTX due to their low fees and excellent liquidity. For limit orders the fee will be 0.02% or less, even as low as a 0.03% rebate (i.e. you get paid when your order fills).

Additional comments.
1) Volume Oscillator showing intermittant bullish div on the daily.
2) 52K range equating to the 0.382 fib level seems ideal entry
3) 3 to 5 day chart has Phoenix indicator with hidden bullish divergence in the making.
Analysis Breakdown
Macro: BTC sells off in a correlation to stocks
Bitcoin has been in an on-chain bullish structure, but despite this BTC price dropped sharply in a trading correlation to stocks as they sold off due to fears over the new COVID variant that’s been discovered.

HODLer demand for BTC continues to climb
Fundamental demand for Bitcoin remains unchanged, it continues to strengthen, no different in structure since my last letter. In the chart below I’ve highlighted the HODLer demand (as measured using the Supply Shock metric) and compare it to the COVID crash of 2020. In this case we are not seeing any kind of sell-off.
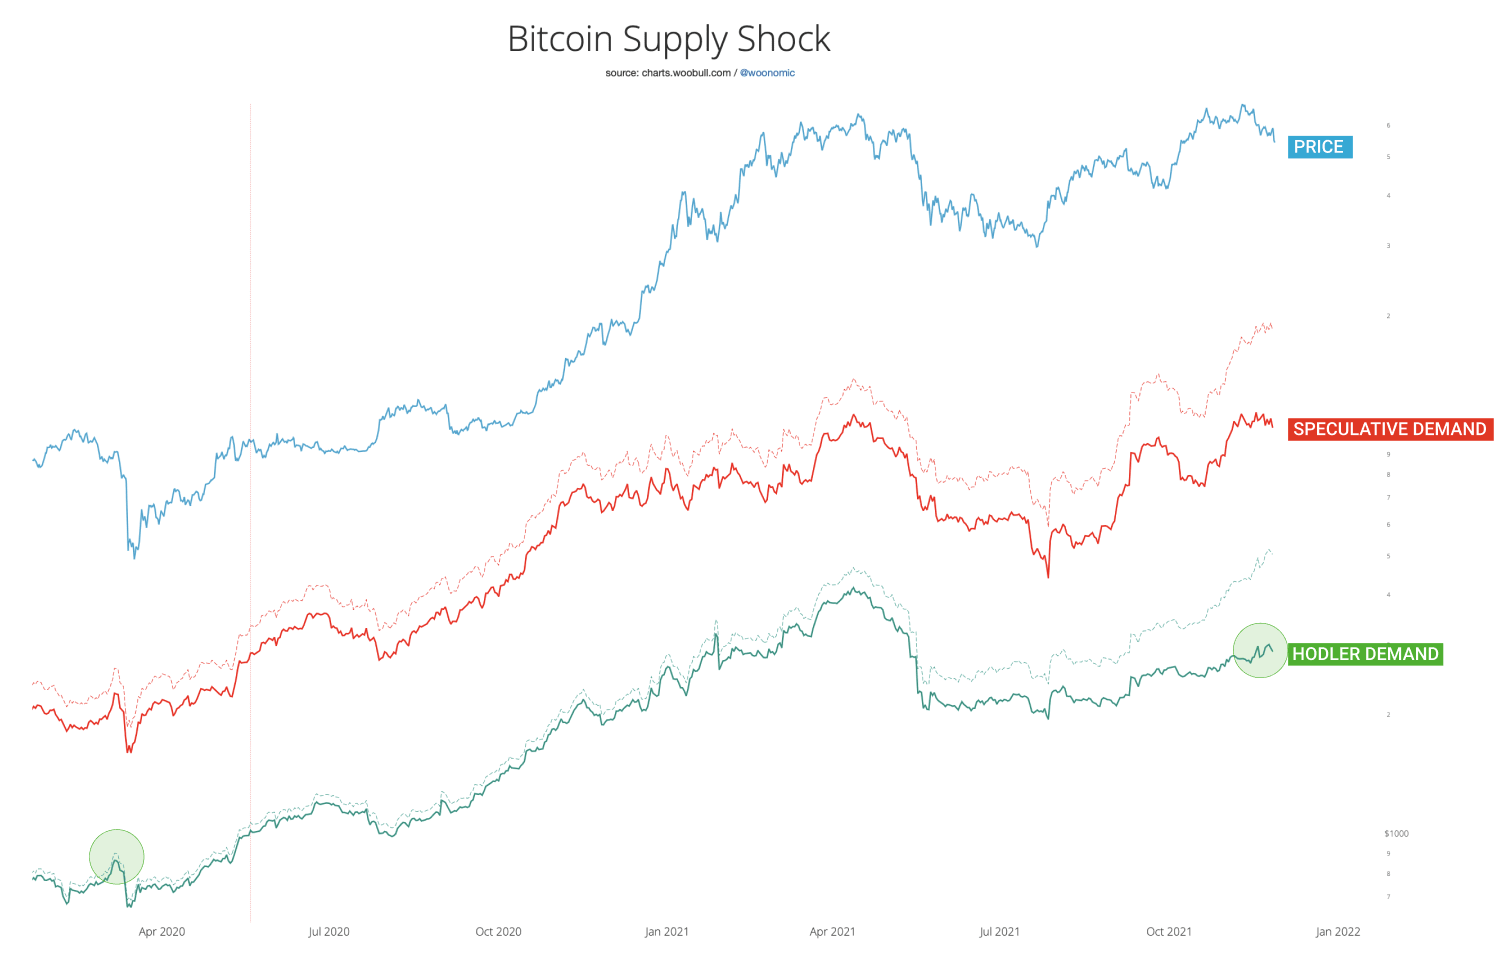
In the heatmap below we can see how the behaviour of HODLer profile of investors are completely different this time around. I’ve compared this event with the mini-bear crash we had in May and the COVID crash last year. The lower trace tracks the buying and selling movements of HODLers, these investors are ones in which we can see via on-chain forensics, looking into their wallet movements, that they are strong handed investors that predominately accumulate (i.e. “Rick Astley”). Presently these investors are buying.

HODLer strength is in a region of bullishness. This is a relatively new metric I’ve been working on that measures movements in illiquid supply vs liquid supply. In simple terms, this is the change seen in coins held by investors that accumulate vs speculative holders. Again the differences in structure from where we are now and the last two bear phases are clearly different.

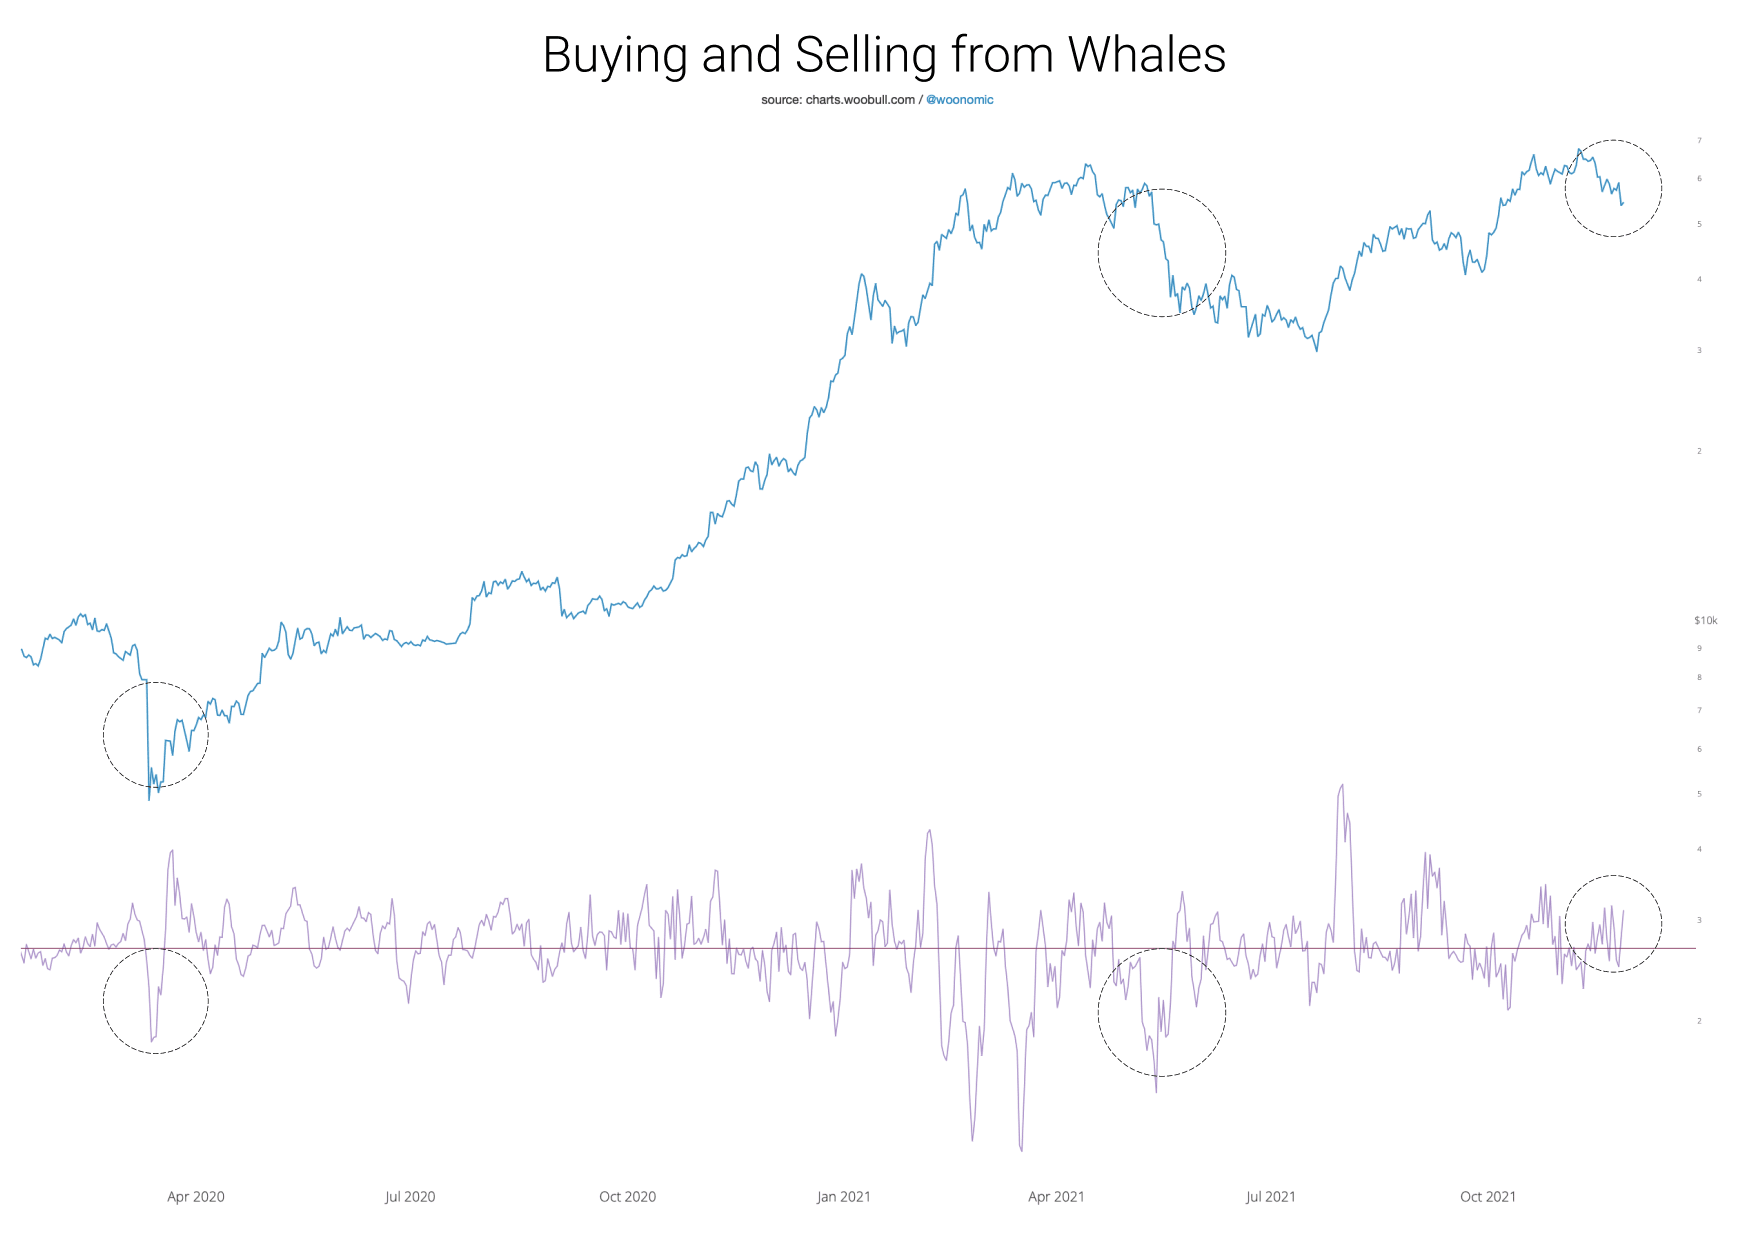
To complete the set of on-chain structure, I’ve included the chart below tracking the coins moving in and out of whale investors. As a cohort whales are buying this dip, again this is complete different behaviour from the bearish activity we saw in May and COVID 2020.
Exchange data suggests the bottom is in
The chart below is something new I’ve been working on to get a better read on shorter timeframe tops and bottoms. I joked on Twitter this was technically called the pink dotted line oscillator.
This is not an on-chain metric. It takes a mix of data from Bitcoin exchanges and applies heuristics and statistical methods to deduce a short time frame oscillator looking for trader buy/sell pressure.
While still early in making this call, the data is showing a price bottom with underlying selling switching to buying from traders. Keen observers will notice a hidden bullish divergence.

ETH and Alt commentary
ETH fundamentals continue to hold strong. While BTC is structurally bullish, it’s not going to make all-time-highs anytime soon and will need to prove out a consolidation band. Taking that into consideration, BTC in sideways usually means ETH and Alts get room to play.

Come and join our channels:
Free Telegram Channel:
https://t.me/joinchat/XV8MbPlKHH9kZDc9
BTC Reports and status update Channel:
http://t.me/Prospa_R_bot
Youtube Channel:
https://www.youtube.com/channel/UC2WX-tmUbt1k6oRYtEu3qBg
Tradingview Profile:
https://www.tradingview.com/u/ssari/#published-charts