Shaken but on track
Dear subscribers,
Welcome to the September 22 report.
My last letter outlined a continuation of a bullish on-chain structure. The price action expectation was bullish while the conviction was downrated due to weakness in the equities market. Earlier this week equities sold off from
China’s Evergrande crisis pulling down BTC price with it.

Top level summary for Top level summary for 22nd Sep 2021 (current price $42.5k):
> Macro & mid-macro: Unchanged, see the last letter.
> Short term: Investors continue to buy, unfazed by the equities sell-off. A divergence between bearish price action and bullish investor demand implies a bullish supply squeeze will happen sooner or later.
> Price action expectation: Despite the locally bearish price action, the forecast is unchanged from the last letter. I expect a bullish move to explore the $50k-$60k price range over the next 2 weeks.
Price action conviction: Medium-high.
All the best until the next letter.
——————————————————————————————————————————————-
Please do not trade on this forecast assuming perfect accuracy. All forecasts are probabilistic with roughly 80% historical reliability for short time frame forecasts. Short time frames are subject to unpredictable events and the randomness of markets, please use appropriate risk management. Longer range forecasts are more reliable as it takes time for fundamentals to play out.
Analysis Breakdown
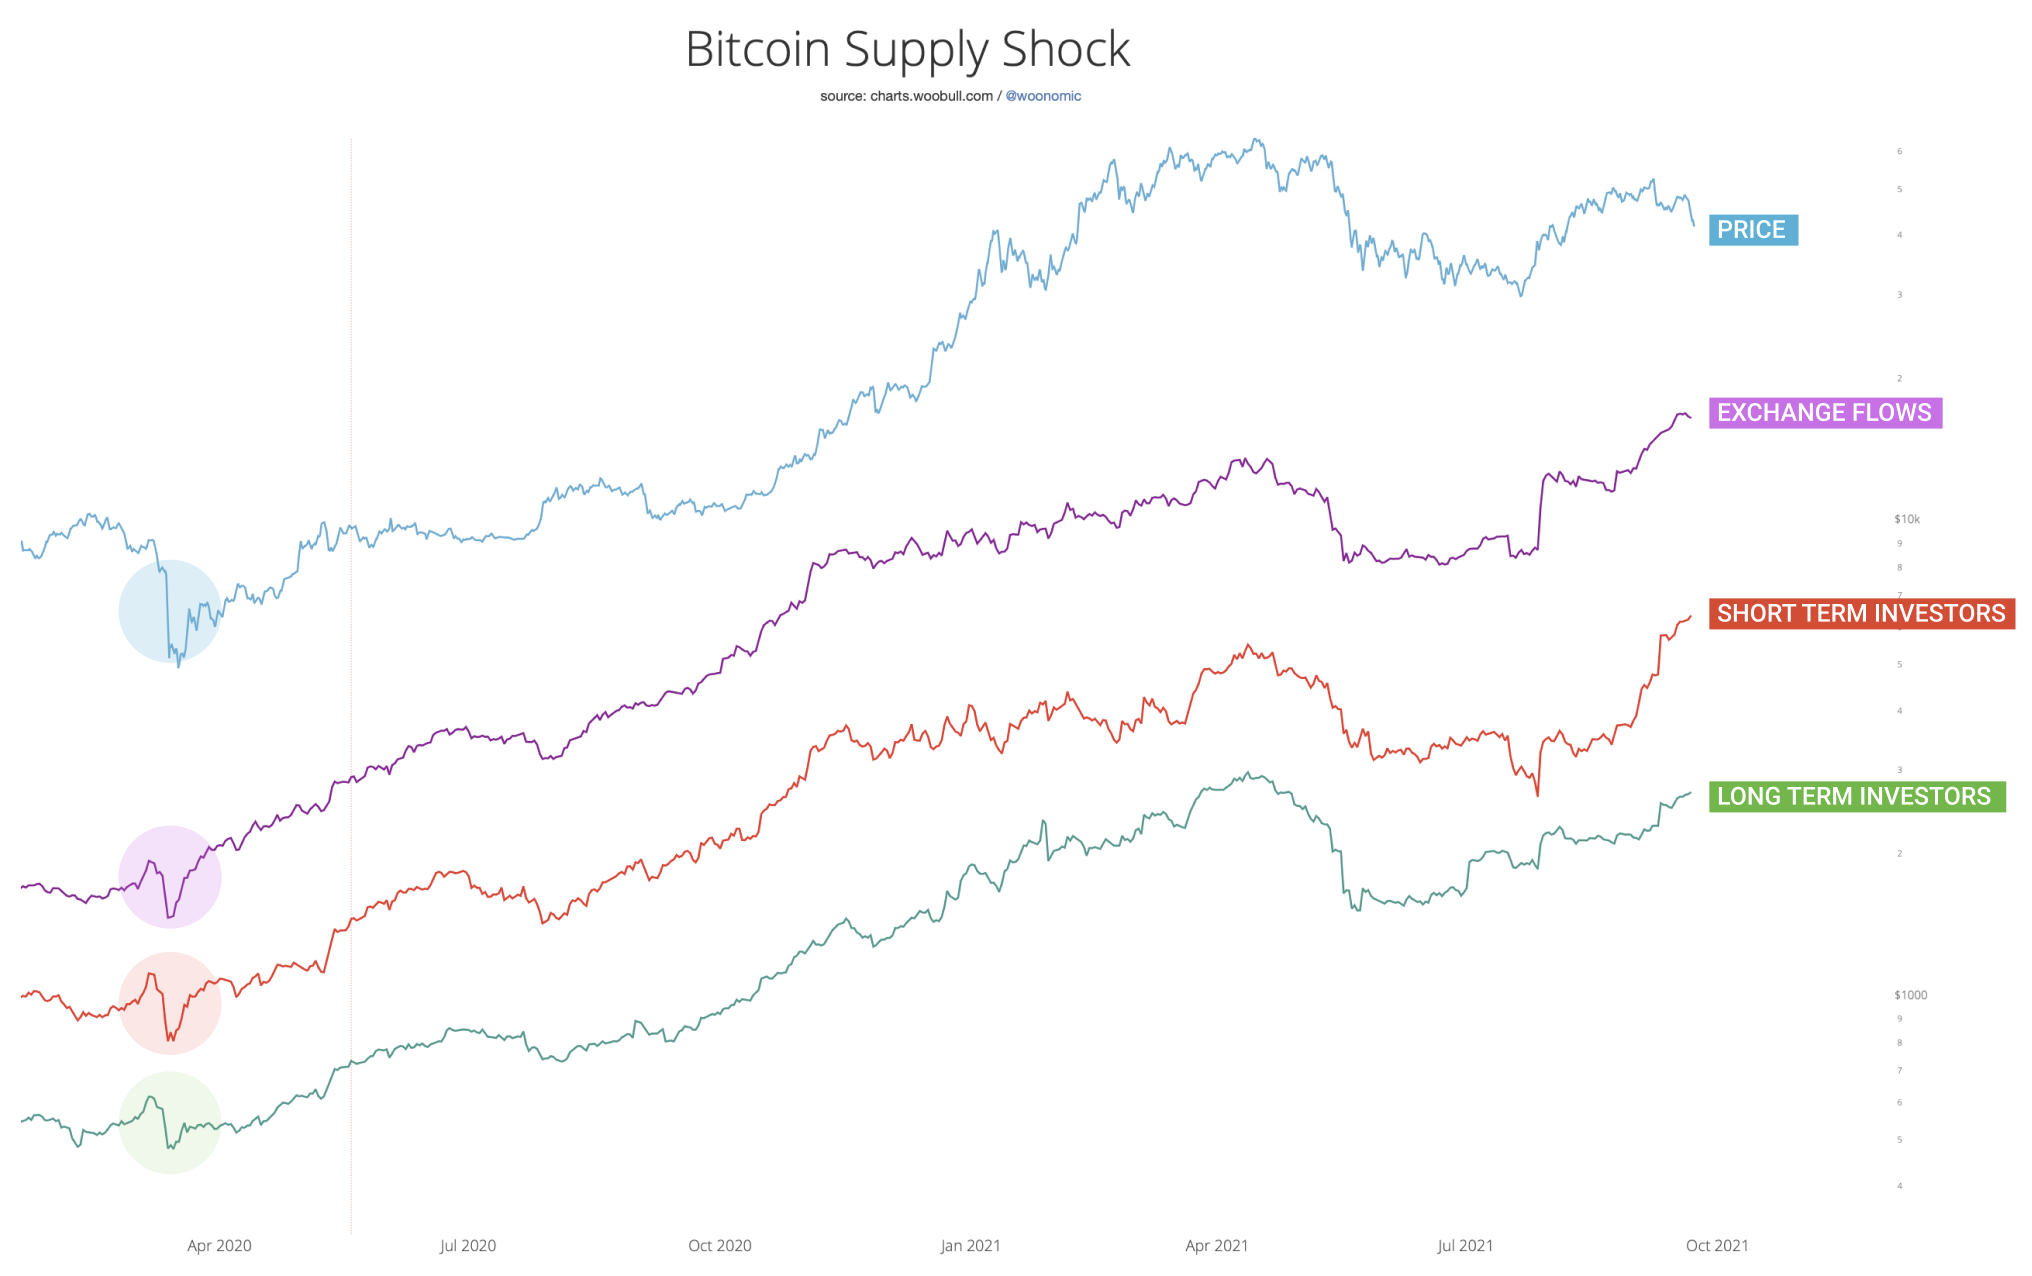
LONG TERM INVERSTORS CONTINUE TO BUY
In the face of equity market fears, BTC sold off in a flight to safety, currently 23% down from its local highs in comparison to a 4% sell-off in equities. Even at first glance it seems like an overreaction by BTC speculators.
Meanwhile long term investors continue their accumulation of coins, completely unfazed. I’ve marked in the chart below the COVID19 white swan event when the market last had a significant sell-off in a flight to safety. During that
time we did see some selling down from long term investors, however this current situation does not show any of this weakness. In effect the short term speculative sell-off is unjustified and unsustainable.
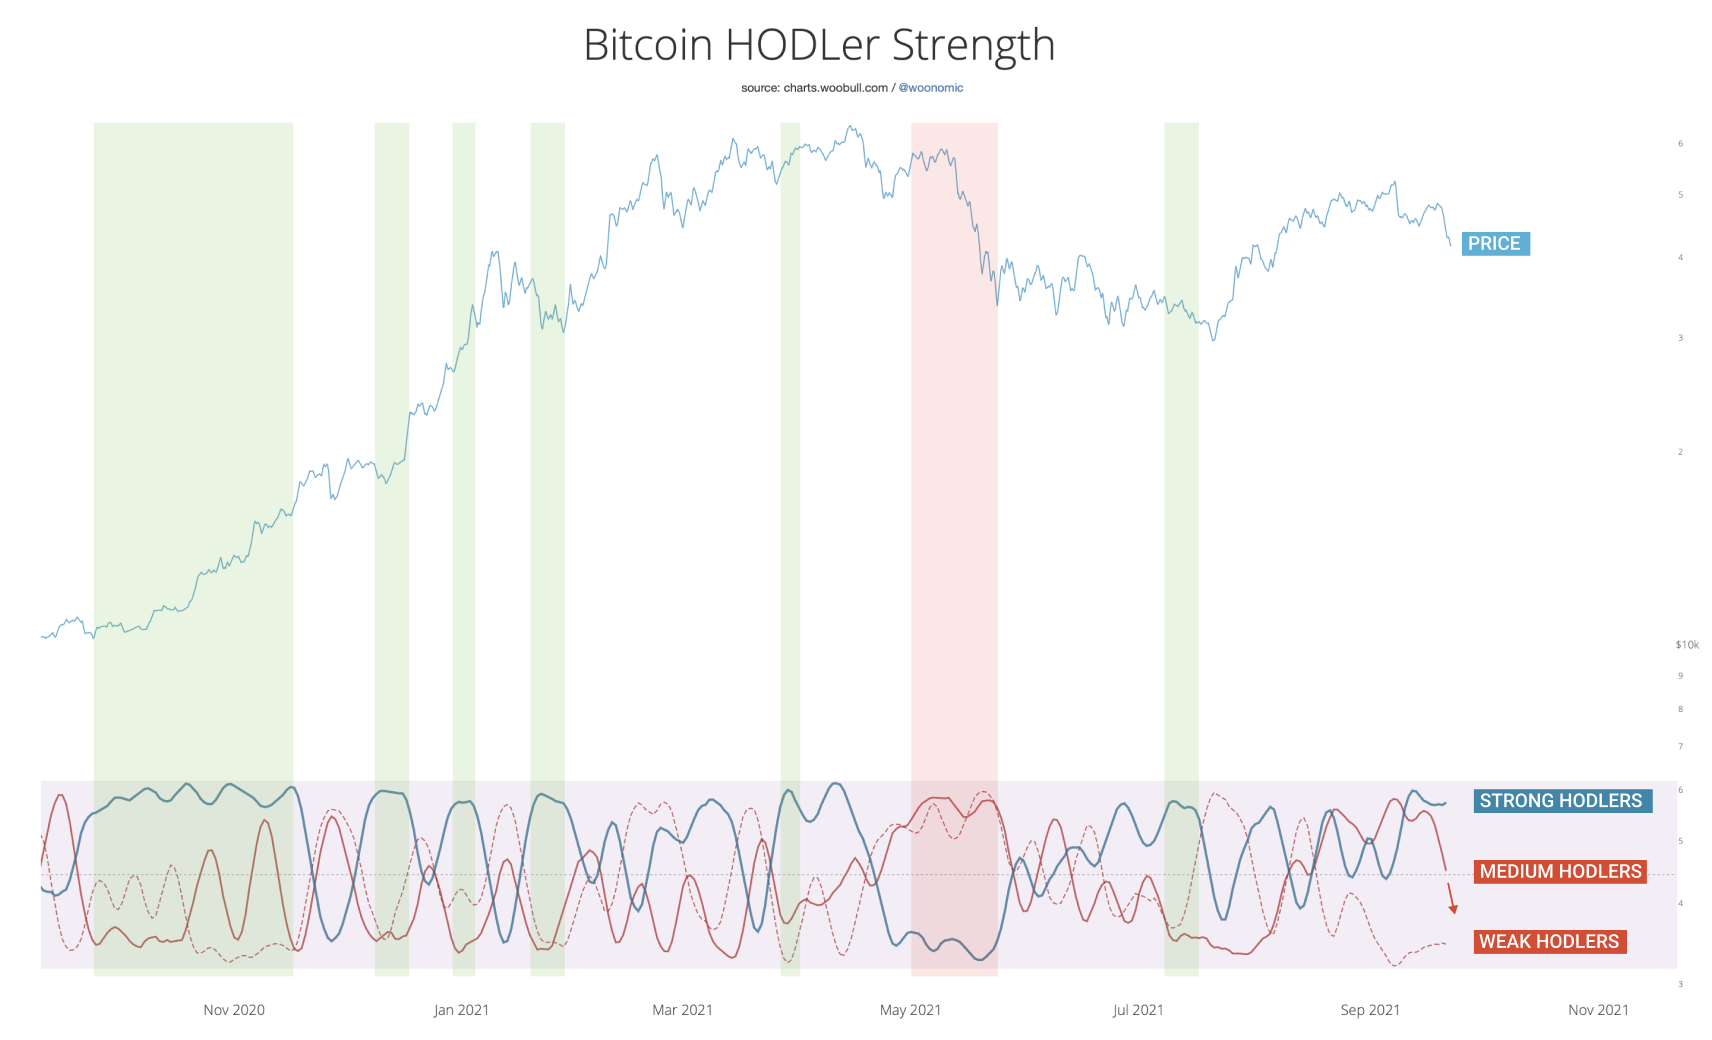
The movement of coins between investors trending towards a perfect setup for a rally
The chart below is something new I’ve been working on. In this analysis we classify HODLers into 3 categories; strong, medium and weak. Then we track their relative strength to each other as coins move between them. The perfect conditions for a strong rally occurs when strong HODLers are at their peak while weak and medium HODLers are at lows.
As we can see in this chart below, the current setup is moving into this structure, which furthers our case for a bullish rally developing.
ETH commentary
ETH saw a price sell off that was deeper than BTC. Underneath this we also saw a weakening of on-chain investor demand while BTC strengthened. The chart below shows this via a comparison between the ETH and BTC’s supply shock (purple line).
Taking into account ETH’s technical analysis picture which remains bearish, ETH looks like it’s in for multiple weeks of consolidation

Dormancy tracks the average age of coins being moved (assumed sold) on the network per day. Note in this case “age” refers to how long coins have been latent in wallets before they moved, older coins implies the seller has more market experience.
To refine our picture of who is selling, dormancy sheds some light on the matter by demonstrating the coins being sold carried very little age.
I think its probable that high net worth or even speculative institutional holders, who have recently come into Bitcoin from traditional markets, having enjoyed fast gains in this bull market are now taking profit while it’s on the
table, while catalyzed by Elon Musk FUD.
Profit taking nears completion
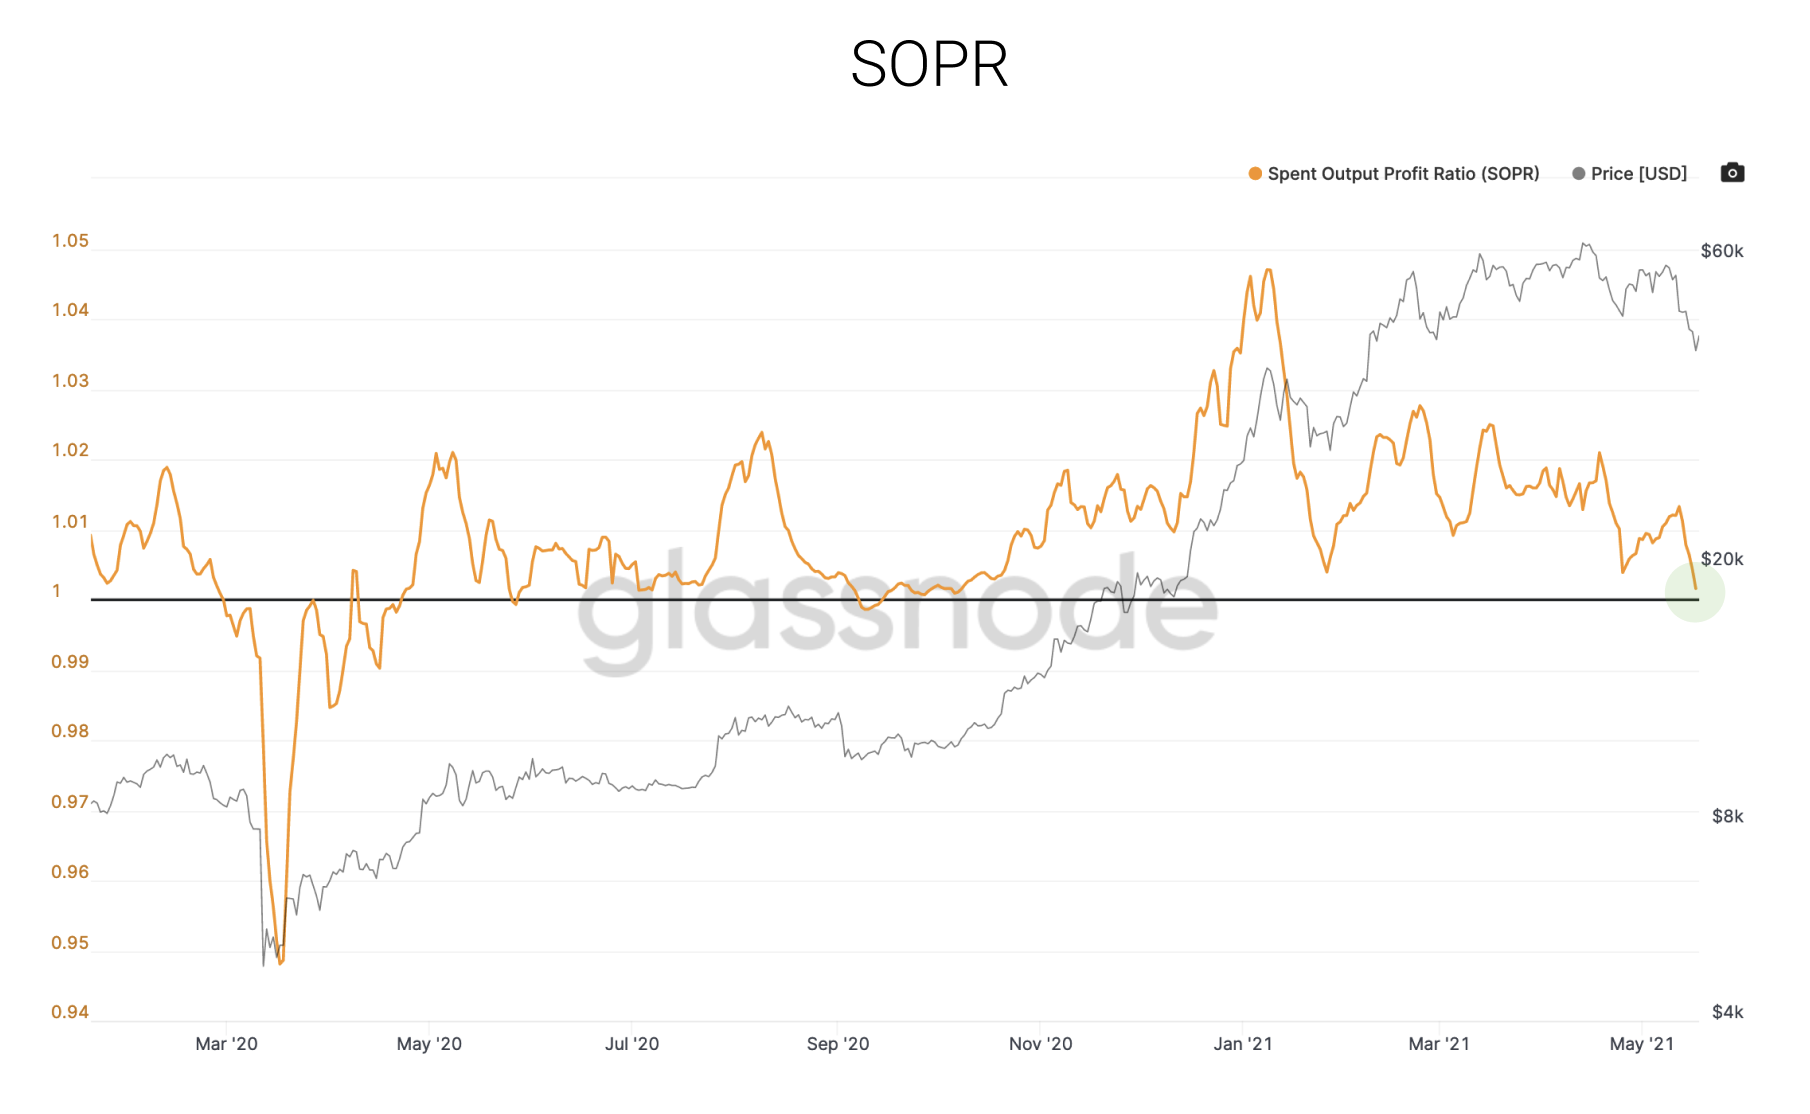
Digging into the profit taking picture with the SOPR chart (on the weekly moving average chart) we can see it has almost reset. In plain English, this means the coins moving between investors are now carrying nearly no profit; profit taking is nearly complete.
For SOPR to keep dropping, the market will need to be willing to sell at a loss, given the amount of coins being dumped onto the market this is a possibility. I’d add this is hardly ever seen when a bull market is in full swing.
Strong hands turning weak

Throughout the last 6 months coins have moved consistently to strong holders, that’s to say holders that have had very little history of selling. This trend has quickly reversed. Coins are now moving to weak hands; or rather holders who were previously strong have started selling thus becoming weak hands. Rick Astley has left the party.
Price is below the floor model

During this sell down, price broke below the floor model. This model uses capital inflows into the network to calculate the floor price, it works during the main phase of a bull run when sufficient inflows of capital can create a floor supported by investors.
Through this lens we’ve entered a bear phase of the market. I’ve only seen price drop below the floor at the start of a bear market, both in 2014 and 2018.
A shorter term rally is open
> Short term technical analysis shows a trend exhaustion window, starting today.
> Short term exchange flows are mildly bullish.
> Short term profit taking (SOPR on the daily chart) has completely reset.
> Dormancy is near a bottom region.
> Price has dipped significantly below fundamental valuation estimated by NVT Price.
Put together there is an opening for a relief rally in the short term. If it happens, it’s unlikely to be a full V-shaped recovery, more of a relief rally. The selling is now very strong; the medium term picture is bearish and this
will need time to turn around.
Long range macro remains healthy
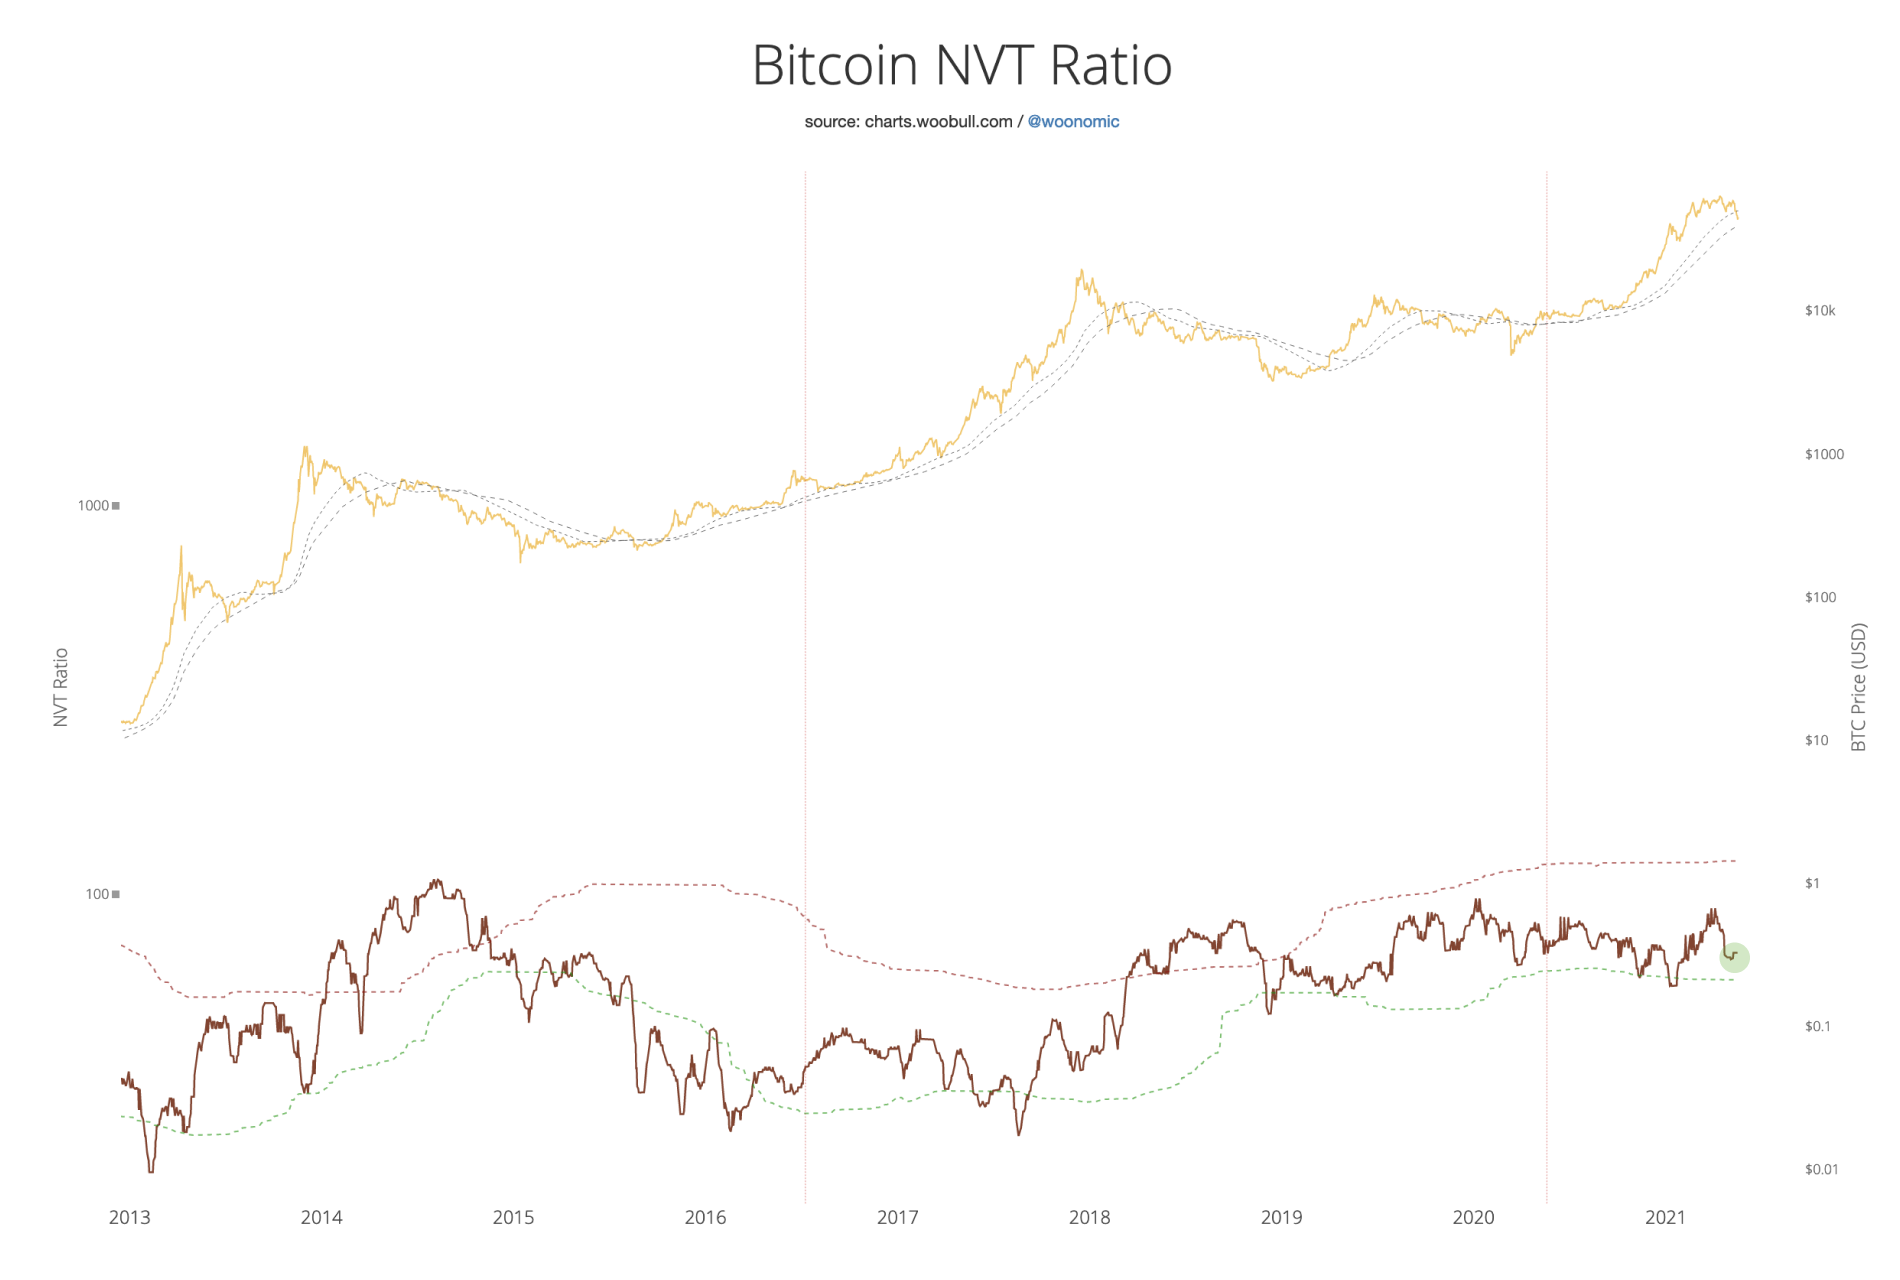
NVT Ratio works like a “PE Ratio” for Bitcoin. It compares the valuation of the network to the investment volume happening inside of it. Low values are bullish as this infers low valuation for a high amount of underlying investor activity,
Very broad range macro indicators like NVT Ratio is very healthy, there are no signs of a typical macro market top
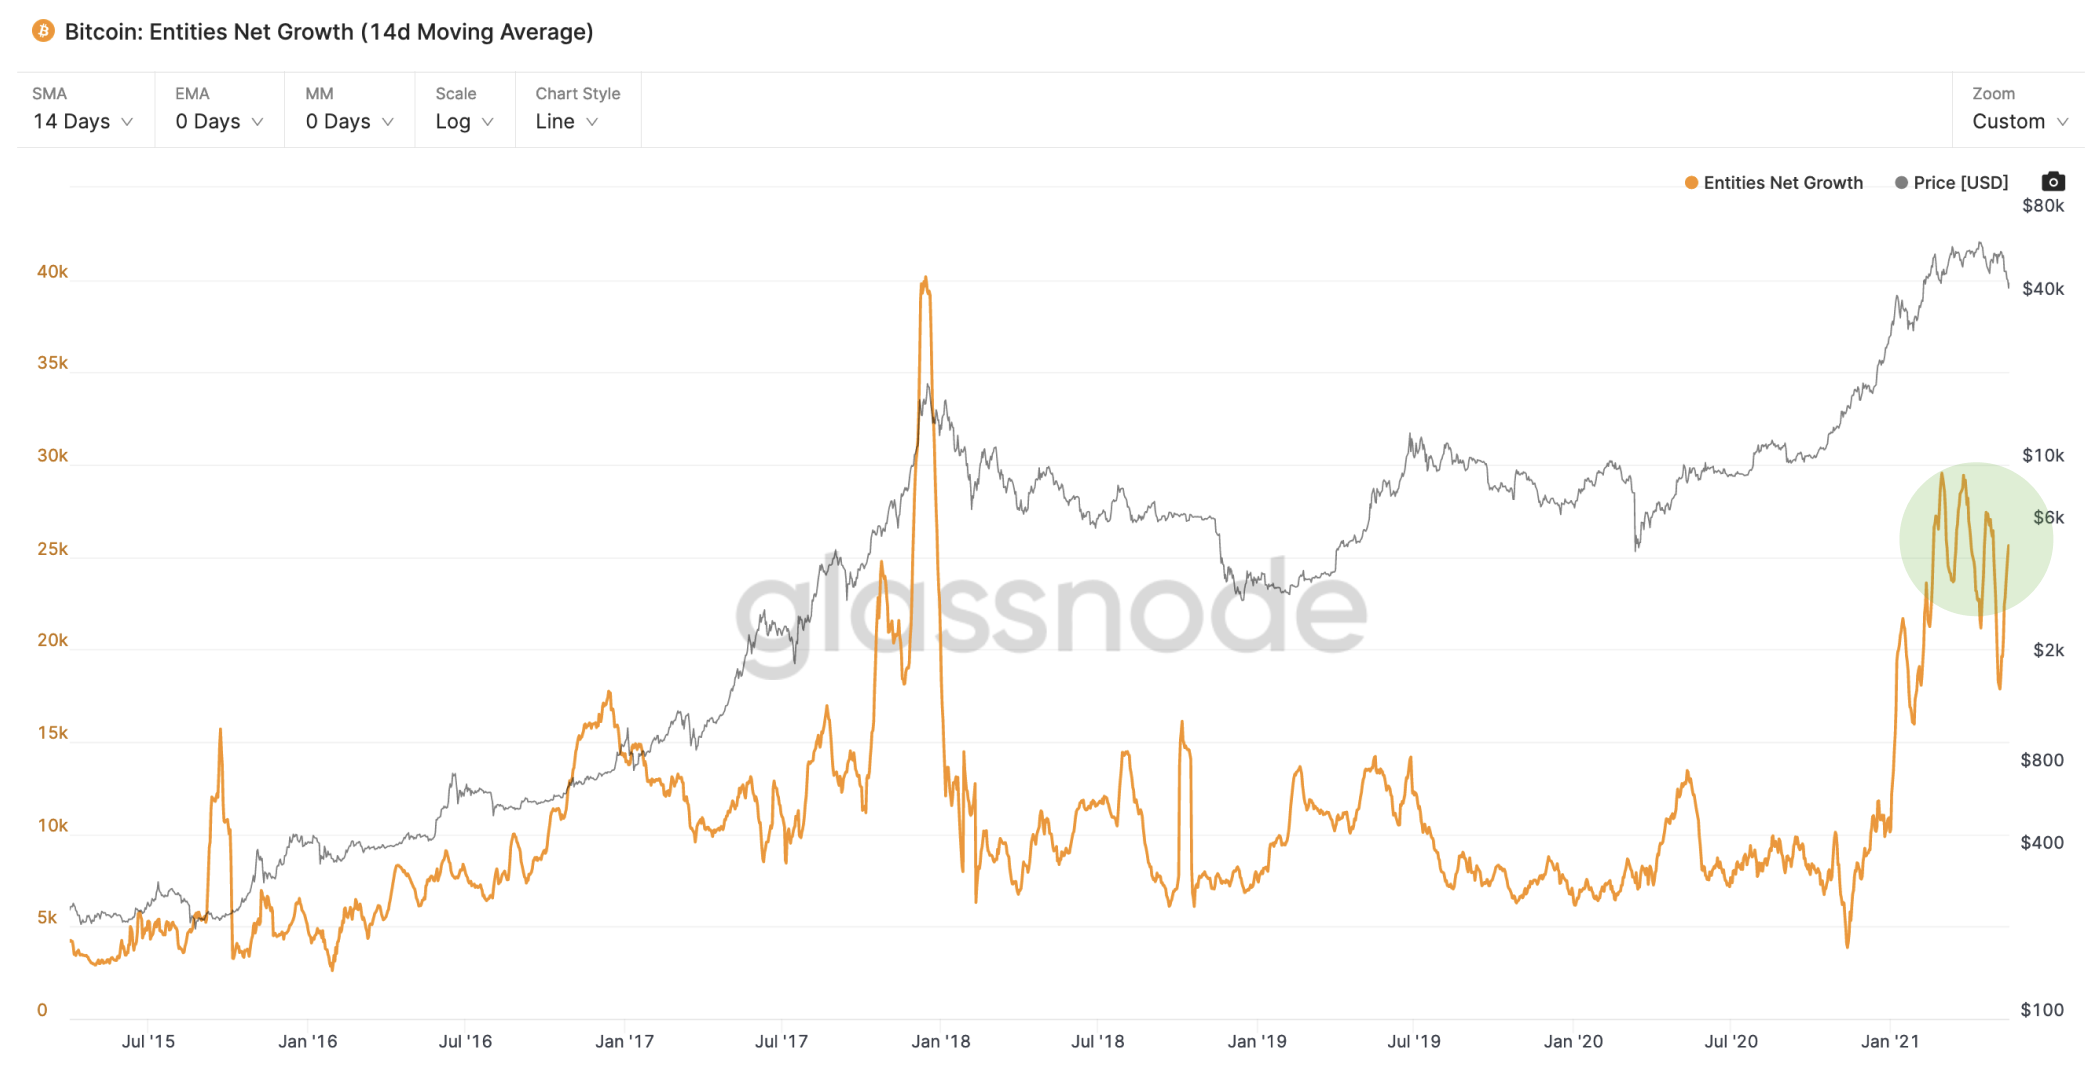
The growth of users on the Bitcoin network has not fallen away especially in the last week of bearish price action. Smaller retail buyers are still coming in, buying this dip, and “stacking their sats” at an unperturbed rate.
The market right now is in the process of shaking off some large demand and supply imbalances.
This BTC chart is post report and goes to validate if this report conclusion was accurate. Note the vertical line, is based on the date of this report
Come and join our channels:
Free Telegram Channel:
https://t.me/joinchat/XV8MbPlKHH9kZDc9
BTC Reports and status update Channel:
http://t.me/TProspa_bot
Youtube Channel:
https://www.youtube.com/channel/UC2WX-tmUbt1k6oRYtEu3qBg
Tradingview Profile:
https://www.tradingview.com/u/ssari/#published-charts
