INTRODUCTION TO ELLIOT WAVES
The material provided here will go a long way into your trading profession. It is essential you understand the basic fundamentals of Elliot wave theory and its why we have it here to become a competent trader.
As you progress and get experience in trading, its important to include Elliot theory to explain the charts (as a exercise) as you decipher a few scenarios to plan potential setups, thereby increasing your ability to make good
trades.
Remember this, a good trader plans and executes, an unprepared trader will make many mistakes if its not planned yet alone planned well.
Elliott Wave Theory was developed by Ralph Nelson Elliott in the 1920s. Its a theory based on observation of the financial markets with characteristic movements that repeat. Hence he called these movements “waves” due to the
highs and lows and cyclical up and down motion. In total there are 13 major Elliott wave patterns. Here we will only go through some enough for you to understand and for you to take it further. For subscribers, the following
pages go through all of them.
Now Elliot wave trading is a broad and complex topic. Here we cover the core basics providing the required fundamentals for understanding the charts. Its not necessarily to be a master at it but enough for you to know what’s
going on at a heuristic / high level . By understanding the story of the chart one can incorporate it into technical analysis andor into their trading strategy. Understand the potential phases in price action, it becomes
clearer where the risks are and where to long or short.
So what are the basics? We have 2 types of waves in principle > impulsive (trend) and corrective waves (consolidation). Therefore moving from impulse waves to corrective waves is a change in trend and therefore you trade
accordingly. Refer to this diagrams below.
Click on any chart for a larger view
The basic Elliot uptrend or down trend cycle pattern consists of 5 individual waves that are linked together (cycle) and achieve progress as market price moves up (or down).
The 5 wave sequence as per this example is called a motive wave, because it propels the market in the direction of the main trend (up) or down.
> The subwaves for 1, 3 and 5 are the impulse waves;
> The subwaves 2 and 4 are called corrective waves (abc), referred to as a correction;
With each corrective wave, we have 3 smaller waves. At times it can be 5 if we are looking at an ABCDE Elliot triangle which leads to complex waves.
The same is true in a downtrend wave.
A typical observation on wave 5 is drop in volume compared to wave 3.
Below is a basic impulse 5 wave pattern:

After the motive phase, that is 5 wave count, we then have a corrective phase, ABC.
It follows a 3 wave sequence or a specific combination (discussed later) of 3 wave structure.
> Wave A & C are impulsive waves and wave B is a corrective wave.
Note: many wave 3 to 4 structure of price action tends to be complex (we cover this later).

Remember this, a dominant trend has 5 wave pattern and a corrective trend has a 3 wave pattern.
TIP: Having Elliot wave theory aligning with Wyckoff theory (price action cycle and its schematics) is a powerful tool.The Wyckoff cycle complements the Elliot wave theory to give you a holistic overview as to what is taking
place. Where Elliot wave theory gives the pivot points, Wyckoff gives you the possible price action within the waves and its stages. We cover Wyckoff schematics in another module.
PART 1 TO ELLIOT WAVES
Now when we breakdown each sub-wave, they to have the same structure, which we can refer to as a fractal nature of Elliot waves. The cycle can continue to smaller timeframes which means each impulse wave will have a sub-set of waves inside of it. Refer to the chart below.

This leads us into the Corrective Waves category, which can be observed to have 3 types of correction and/or a combination known as “COMPLEX CORRECTIVE WAVES”.
THERE are rules and conditions for ELLIOT wave theory.
First Waves (Wave 1)
The first waves are part of the basing process and tend to be heavily corrected by Wave 2. Many people feel that this is one more opportunity to trade in the direction of the previous trend, and, if that was down, many will sell short.
Second Waves (Wave 2)
Second waves tend to retrace so much of Wave 1 that most of the profits gained are eroded, usually ending on low volume and low volatility. In a bear market, this indicates a drying up of selling pressure. However, during Wave 2, most investors are convinced that the bear market is here to stay. Wave 2 never moves beyond the start of wave 1, otherwise its not wave 2.
Third Waves (Wave 3)
Third waves tend to be strong and broad as confidence in the direction of the new trend is clearly evident. Wave 3 usually generates the most volume and price movement and they are most likely to be extended (eg. 1.272, 1.414 or 1.618 fib).
Fourth Waves (Wave 4)
Fourth waves can be predictable in both depth and form because of the guideline of alternation. They tend to differ with the previous Wave 2 of the same degree. They often trend sideways, building a base for the final Wave 5 to spring from. Wave 4 never enters the price territory of wave 1 and wave 2
Fifth Waves (Wave 5)
Fifth waves tend to be less dynamic and display slower speed of price change than the previous waves. They will usually be accompanied by lesser volume and breadth.
Can you see why some are incorrectly labelled? These are based on the Elliot Wave rules.

Impulse wave looks like this:
A very useful tool to help determine waves is the Awesome Oscillator or Elliot wave chart pattern on Tradingview, as part of the indicator suite.
The oscillator compares momentum as the rate of change in price including 5 periods with a 34 period momentum. The biggest swing on the oscillator shows us that we are seeing a wave 3.

CORRECTIVE WAVES
The next stage of understanding Elliot Wave is to look at the Corrective Waves as they become a key challenge for most traders. Corrective Waves come in 3 forms and you might recognise these formations especially
when you see them at high level HTF. They are:
a) Zigzag
b) Flat
c) Triangle
Note: formations can be simple or complex and we have another module that covers this however this module of Elliot wave theory is a prerequisite to formation strategies. ( formation and harmonics)
Lets look at a) the ZIGZAG wave.
Rules: A zigzag always subdivides into three wave correction pattern, labeled A-B-C, also called ZigZag Correction. The ABC correction wave is the simplest of all Elliott wave correction patterns.
> The ABC correction pattern subdivides into 5-3-5 internal wave pattern.
> Waves A and C tend towards equality in length.
> The ABC correction wave usually appears in the position of wave ‘2’.
> An ABC correction wave will usually target the 61.8% retracement of the trend move.
> i) Wave A always subdivides into an impulse or leading diagonal;
> ii) Wave C always subdivides into an impulse or diagonal triangle;
> iii) Wave B always subdivides into a zigzag, flat, triangle or combination thereof;
> iv) Wave B never moves beyond the start of wave A;
This wave in short is 5-3-5 however as a note with item iii) states, the B wave can be other combinations, like a flat, or triangle or another zigzig. The fact that the B wave can lead into an X wave. More of that later on.
When the structure is complete and wave C has come to an end, A trader can place an order at the end of wave B, expecting the price to turn back into trend again.

DOUBLE ZIGZAG
This is a more complex wave even though it has a zigzag with another zigzag, the double zigzag forms when two separate simple zigzags come together via a X wave, to form the larger structure. (refer to the video below for Complex Waves, where we talk about 2 Flat patterns joining with an X wave).
Here are the main Elliott wave rules for double zigzag corrections:
> The WXY correction pattern subdivides into 3-3-3 internal wave pattern.
> Waves W and Y tend towards equality in length.
> The WXY correction wave usually appears in the position of wave ‘4’ or wave ‘B’.
How to trade this?
If things line up well as is, the longing or entering at Y makes sense with a close stop loss.
Obviously the context in such cases requires Y to be a solid level of support with confluence to a major fib, MA, etc.
If the candle is bullish, like a pin bar, then combined with a SFP, its a good entry.

In conclusion, we have 2 trade setups that also can fit into some harmonics. The differences between them is the context of support and resistance as well as the bigger picture.

FLAT WAVE / PATTERN
Lets look at B) the FLAT wave.
> A flat always subdivides into 3 waves;
> Wave A is never a triangle;
> Wave C is always an impulse or a diagonal triangle;
> Wave B always retraces at least 90 % of Wave A.
> i) Wave B usually retraces between 100 and 138 percent of wave A.
> ii) Wave C is usually between 100 and 165 percent as long as wave A.
> iii) Wave C usually ends beyond the end of wave A.
We have 3 types of FLATs, regular FLAT, expanded FLAT and running FLAT.

REGULAR FLAT
This is a simple 123 or ABC wave, labelled A, B, C or 123. It is a corrective pattern that runs counter the trend. The pattern tends to be a shallow retracement of the previous trend and may be the ‘flag’ of the common flag
pattern at times. Some have gone to more details about this pattern with rules.
Rule 1: Wave A should be a 3 wave structure;
Rule 2: Wave B should be greater than 61.8% of Wave A;
Rule 3: Wave C is greater than 38.2% of Wave A (otherwise it starts falling into a contracting triangle);
Rule 4: Rule of alteration: it states that adjacent or alternate waves of the same degree should be different and non matching in as many ways possible;

EXPANDED FLAT
The expanded flat correction is a common corrective structure seen in wave 2 and 4 of a Motive Wave, the connector in a Zigzag or any part of a Double or Triple Correction. In a bullish trend scenario, price moves against the
trend lower in a 3 wave structure to form wave A.
Wave B also is a 3 wave structure and advances beyond the origin of wave A to an extension most commonly 123.6% of wave A. The invalidation level for the completion of wave B is above 161.8% of wave A.
Wave C needs to be a 5 wave (motive wave) structure and hold RSI divergence between wave 3 and 5 at completion. Common areas for completion of wave C lie at the 100% to 123.6% extension of wave A projected from the end of
wave B with invalidation being beyond the 161.8% extension. If wave C ends before making a new low below wave A, the structure is called a running flat.

RUNNING FLAT
The main difference with a running flat chart is that wave B is longer than wave A, but wave C is shorter than wave B
In an expanding Flat, wave B is longer than wave A and wave C is longer than wave B

Triangle patterns are common technical analysis patterns that can indicate potential price continuation or reversal in financial markets. These patterns are characterized by converging trendlines that form a triangular shape on a price chart.
There are three main types of triangle patterns:
Symmetrical Triangle: In a symmetrical triangle, both the upper and lower trendlines converge towards each other. This pattern suggests a period of consolidation and indecision in the market. Traders often look for a breakout from the triangle pattern, which can signal the continuation of the previous trend or a potential reversal.
Bullish Breakout: If the price breaks out above the upper trendline, it could indicate a bullish continuation.
Bearish Breakout: If the price breaks out below the lower trendline, it could indicate a bearish continuation.
Ascending Triangle: An ascending triangle has a flat upper trendline and a rising lower trendline. This pattern suggests that buyers are becoming more aggressive over time, potentially leading to a breakout to the upside.
Bullish Breakout: If the price breaks out above the flat upper trendline, it’s seen as a bullish continuation signal.
Descending Triangle: A descending triangle has a flat lower trendline and a declining upper trendline. This pattern suggests that sellers are becoming more aggressive over time, potentially leading to a breakout to the downside.
Bearish Breakout: If the price breaks out below the flat lower trendline, it’s seen as a bearish continuation signal.
From an ELLIOT Wave perspective, a triangle wave refers to a specific type of corrective pattern that occurs within the context of the larger Elliot Wave structure. From this perspective, there are 5 main types of triangles
within Elliot Wave Theory.
1) Contracting Triangle;
2) Expanding Triangle;
3) Neutral Triangle;
4) Ascending Triangle;
5) Descending Triangle.
Triangles are known for their complex internal sub-wave structures and their identification requires a deep understanding of Elliot Wave Theory.

CONTRACTING TRIANGLE
The contracting triangle is a horizontal contraction in range of the price.
An Elliott wave triangle traces out five internal moves each of three waves.
The distance traveled by each subsequent wave reduces in length.
This has the effect of contracting the range of the wave, hence the name!
A low risk trade can be placed at the end of wave ‘e’ with the idea of catching the market as it turns back into the trend.


EXPANDING TRIANGLE (ET)
An Elliott wave expanding triangle appears in both downtrends and up-trends and one would say are rare, than regular occurring. Like we said, its a continuation pattern however at times don’t be surprised that it turns our
to be a reversal as well as it fits into the wyckoff accumulation structure.
The top trend line rises and the bottom trend line falls, and the overall range of prices expands into wave ‘e’.
This time the end of wave ‘b’ of the Elliott wave triangle is used to place a trend trade.
My thoughts are that this takes place for liquidity hunts for the top ranging levels as well as the low range levels. Then ultimately, it gets exhausted and the bulls or bears keep control depending on the prevailing macro
trend.


DESCENDING TRIANGLES
A descending triangle usually appears in a downtrend.
The lower bound of this Elliott wave triangle pattern holds in a flat line while the top trend line drops as usual, and the overall range of prices contracts.
A low risk trade can be placed at the end of wave ‘e’ with the idea of catching the market as it turns back into the trend.

ASCENDING TRIANGLES
The ascending triangle usually appears in an uptrend.
The upper bounding trend line of this Elliott wave triangle pattern holds in a flat line and the lower trend line rises, and the overall range of prices contracts into wave ‘e’.
Again, the same strategy applies, a low risk trade can be placed at the end of wave ‘e’ with the idea of catching the market as it turns back into the trend.

The following a real life triangular corrective patterns.

Wedge pattern are similar to triangle formation, which have two converging trendlines. There are basically two types of wedge pattern. The falling and the rising wedge, which can either occur in a uptrend or downtrend market. This leaves us with four variations of the wedge pattern.
What should be considered first is the overall market structure. Is price currently bullish or bearish?
A rising wedge is a reversal pattern in an uptrend and a continuation pattern in a downtrend. For the falling wedge the exact opposite is true. It is a reversal pattern in a downtrend and a continuation move
in an uptrend.
It is possible to get an ENDING Diagonal Wave inside of Wave 5 or Wave C. Instead of the standard 5-3-5-3-5,
it is a terminal impulse ending in 3-3-3-3-3 where each wave is corrective price action.
Wave 1 and 4 overlap:
Wave 1 is normally the longest;
Each wave subdivides into an ABC or WXY;

Combining the wedge pattern with Elliott Waves
The wedge pattern can also easily be labelled with waves accordingly to the Elliott wave theory. A rising wedge for example can represents a leading diagonal as wave 1 or an ending diagonal as wave 5 in an impulse. So the next move will be either Wave 2 or wave A of a correction on degree higher. Both being countertrend moves and therefore a “reversal” of the preceding trend.
The continuation variation in an uptrend is the falling wedge. This pattern often occurs as wave 4 and has also 5 subwaves, which are labelled A-B-C-D-E and represents a triangle formation.
In an downtrend, the falling wedge is spotted at the end of overall movement and is then a ending diagonal. A strong signal that the ongoing trend is over.

WAVE 1 to 5 with all the subwaves of LINK
Note how the macro fits into the rising wedge scenario. (LINK TOKEN)
Each section has a wave 5 count (subwaves) along with the corrective waves of ABC
BEAR Market Wave 1 to 5 cycle (MOTIVE Wave followed by CORRECTIVE Wave).
The demonstrates the cycle in a bear market, Elliot wave count with a downtrend.
Note: Using Elliot wave theory along with fibonacci and potential some indicators, we might be able to forecast the bottom.
reference: https://www.tradingview.com/chart/kL57pOqo/

Diagonal Waves (wave 4 to 5 above)
Rules
>> A diagonal triangle always subdivides into five waves;
>> An ending diagonal always appears as wave 5 of an impulse or wave C of a zigzag or flat;
>> A leading diagonal always appears as wave 1 of an impulse or wave A of a zigzag;
>> Waves 1, 2, 3, 4 and 5 of an ending diagonal, and waves 2 and 4 of a leading diagonal, always subdivide into zigzags;
>> Wave 2 never goes beyond the start of wave 1;
>> Wave 3 always goes beyond the end of wave 1;
>> Wave 4 never moves beyond the start of wave 3;
>> Wave 4 always ends within the price territory of wave 1;
>> Going forward in time, a line connecting the ends of waves 2 and 4 converges towards (in the contracting variety) or diverges from (in the expanding variety) a line connecting the ends of waves 1 and 3;
>> In a leading diagonal, wave 5 always ends beyond the end of wave 3;
>> In the contracting variety, wave 3 is always shorter than wave 1, wave 4 is always shorter than wave 2, and wave 5 is always shorter than wave 3;
>> In the expanding variety, wave 3 is always longer than wave 1, wave 4 is always longer than wave 2, and wave 5 is always longer than wave 3;
>> In the expanding variety, wave 5 always ends beyond the end of wave 3;

Guidelines:
>> Waves 2 and 4 each usually retrace .66 to .81 of the preceding wave;
>> Waves 1, 3 and 5 of a leading diagonal usually subdivide into zigzags but sometimes appear to be impulses;
>> Within an impulse, if wave 1 is a diagonal triangle, wave 3 is likely to be extended;
>> Within an impulse, wave 5 is unlikely to be a diagonal triangle if wave 3 is not extended;
>> In the contracting variety, wave 5 usually ends beyond the end of wave 3 (Failure to do so is called a truncation.);
>> In the contracting variety, wave 5 usually ends at or slightly beyond a line that connects the ends of waves 1 and 3 (Ending beyond that line is called a throw-over.);
>> In the expanding variety, wave 5 usually ends slightly before reaching a line that connects the ends of waves 1 and 3;
* Note: We have found one diagonal triangle in the Dow in which wave four did not reach the price territory of wave one. See Figure 1-18 in Elliott Wave Principle.
COMBINATION CORRECTIONS
A Elliott wave double or triple three combination, is a corrective Elliott wave pattern. It happens when simpler wave forms stick together to form a larger structure.
For the most part, double three’s and triple three’s are horizontal in character.
** There is never more than one zigzag in a combination wave, also there is never more than one Elliott wave triangle.
All of the Elliott wave patterns shown above take the same form whether the trend is rising or falling, in a falling trend, the image is simply inverted.


COMBINATION CORRECTIONS – TRIPLE ZIG ZAG
A Elliott wave double or triple three combination, and are corrective Elliott wave patterns. Here is the EURO.USD on the 12 hrly TF.
Interesting to see it becomes a descending wedge.


It is possible to get an ENDING Diagonal Wave inside of Wave 5 or Wave C. Instead of the standard 5-3-5-3-5,
it is a terminal impulse ending in 3-3-3-3-3 where each wave is corrective price action.
Wave 1 and 4 overlap:
Wave 1 is normally the longest;
Each wave subdivides into an ABC or WXY;
This video explains complex waves using 2 flats connected to via an X wave plus more.
PRACTICAL EXAMPLES
Real live charts with T.A. in reference to Elliot Waves
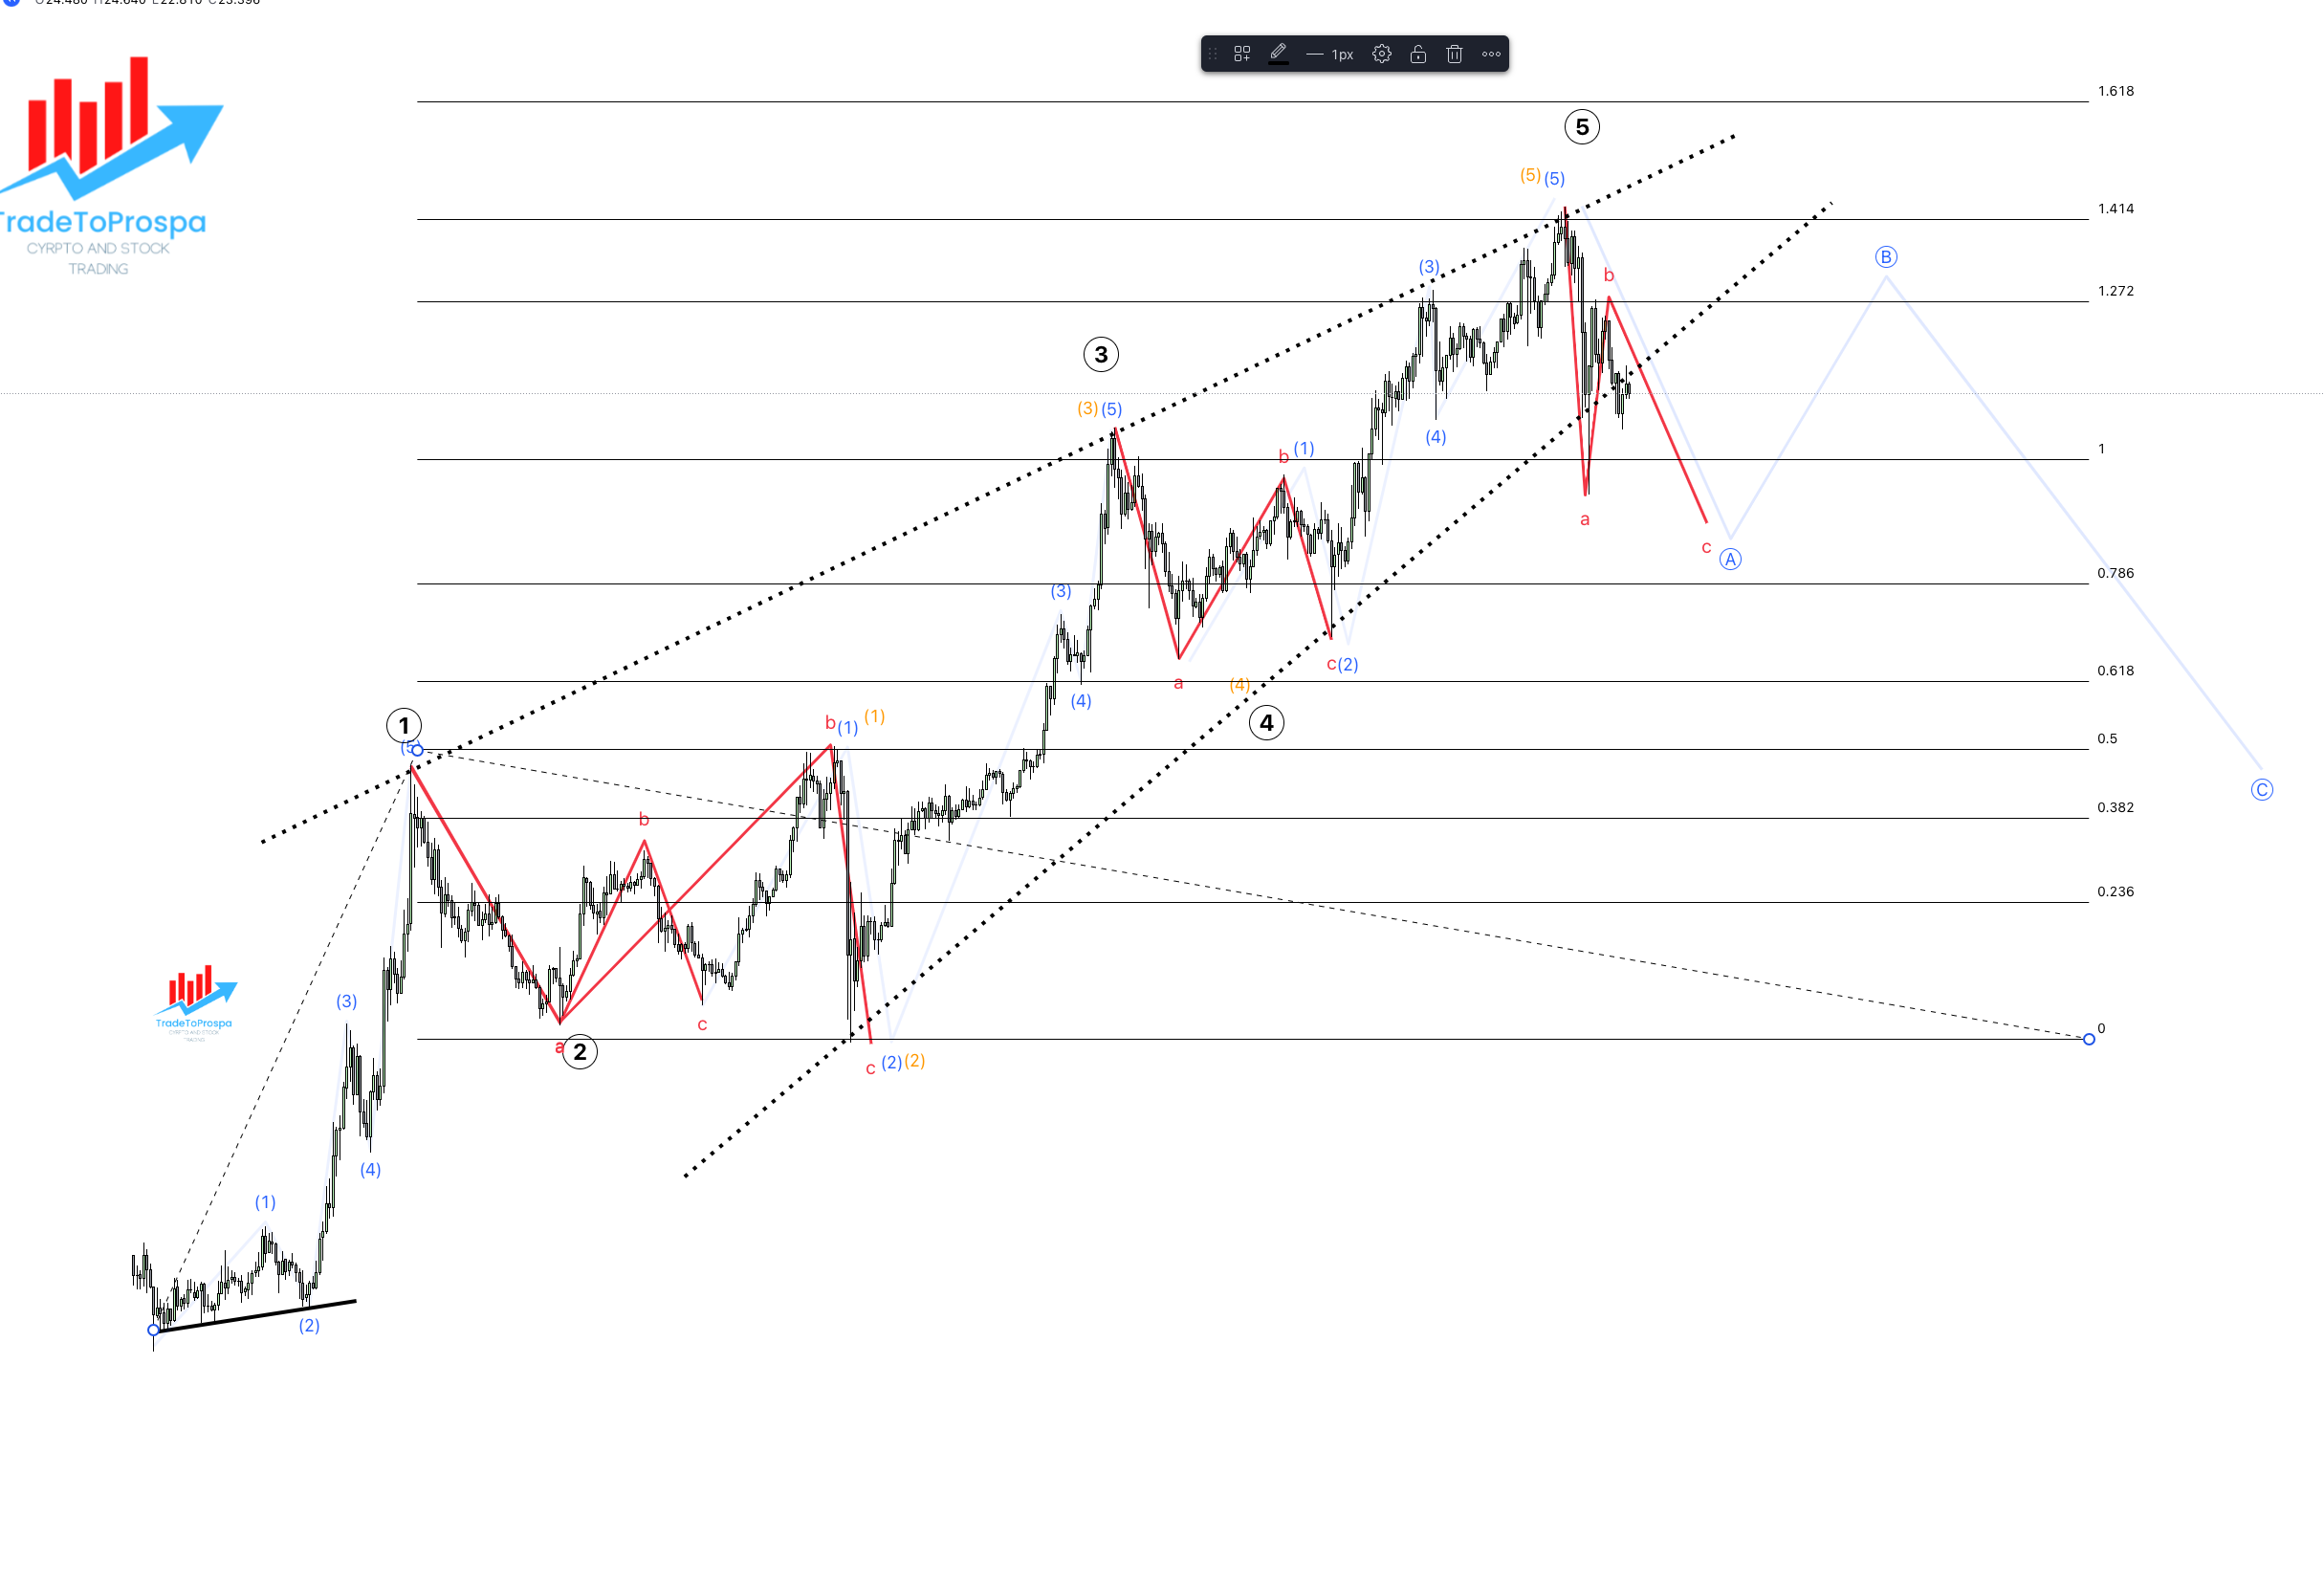
We have a chart aligned with the Elliot wave as an UP-TREND (motive wave) price action.
What we can see is that wave 1 to 2 looks like accumulation structure (a range of price action). It would be good for you to cross reference this with Wyckoff accumulation
Wave 3 to 4 is re-accumulation, ranging as well but much more complex. It would be good for you to cross reference this a complex corrective wave assessment (along with the wyckoff re-accumulation).
Having reach wave 5 on the higher time frame, we see a bear market of some sort. This corrective wave of ABC can also be a 5 wave count. This then aligns with Wyckoff cycle as well.

Usually when we hit the top, it is assumed to be wave 5 and in such cases, it will be a distribution type of structure and hence a complex wave. With Wave 3 impulse,

This 2nd example, below is also Bitcoin but from its early days to 2017 top. Note the parabolic stage and the difficulty trying to fit in the Elliot wave count (on parabolic trends). Similarly the bear market Elliot wave count from 2017 top to 2018 bottom.

REN TOKEN – ELLIOT 5 WAVE (Motive Wave) – Wave 4 seems to be a triangle wave. Wave 2 looks like a combination wave of some sort.

BTC snapshot from 2022 with ATH, assumed to be wave 5 and then the bear market and what took place so far.
Is it worth breaking it down more?

Wyckoff Distribution Contracting Triangle


Descending wedge, followed by rising wedge or running flat

Here is a chart with 2 corrective wave, formations.
1) Descending Broadening Wedge
2) Continuation pattern
This example from mid 2021 for Bitcoin demonstrates how some formations are straight foreword.

Sample of Elliot wave triangle (Outer line flat, inner line sloping with larger trend)
Here is an example of a Descending Triangle. Can you identify where you take the trade, buy long.
Note how this large structure is actually a continuation pattern.
Can you see how we have an extra touch between b) and d) on the resistance line. This gives weight to the pressure is to the upside.

An example of a complex wave: This example from mid 2020 for Bitcoin demonstrates how complicated some formations can be..
At the time, I recall selling and buying with section of this without knowing what the end game was. Towards the end, I had 2 possible plays, both bullish. The context of this resistance was the 10k resistance and the big
3 year resistance trend line, so the resistance was clear but the breakout only came at the end.
Reference to post:
Link

INITIAL WAVE 1 TO 2
This is a screen shot of LINK when it was first released, in a bull market. Note the formations.

Notes on Leverage trading
In terms of when do you think is a good time to leverage a trade, where would you think its the most profitable and safe?
To Margin or Leverage long is not between wave 3 and 4 as this could be a difficult stage to trade and then odds are against you. However entering a trade from wave 2 to 3 is always
profitable as well as wave 4 to 5. Leverage short is obviously wave 3 to 4 and the end of wave 5. The trick is to know when that starts.