#forecast 021 : Come on, do something
Dear subscribers,
Welcome to The Bitcoin Forecast #021.
In my last forecast we saw multiple signs that on-chain structure was shaping in a pattern similar to the COVID19 white swan recovery, thus I had an expectation price would recover over 4-6 weeks into the $55k-$65k band. The market at the time was in peak fear with concerns of a further drop into the $20k region.
My shorter term expectation was sideways to bullish over 2-3 weeks based on the recovery dynamics visible on-chain. Indeed, price has been range bound in a sideways accumulation band, with the last week seeing price action tending bullish with higher lows.
With price action in its current slow sideways “come on, do something” mode, we’ll explore how the structure has developed. Overall this letter is a continuation of the last forecast without much changing, apart from further confirmation.
summary
Top level summary for 2nd July 2021 (current price $33.3k):
Top level summary for 17th Jun 2021 (current price $38.5k):
Macro Long term: There’s further evidence that the bull market is intact with user growth contining to climb higher. NVT Ratio which looks at investor activity also points bullish, this indicator signals bearish at the end of the macro cycle; no signs of the bull market ending here.
Medium term: The medium term picture (over the coming months) is a question of how quick will the recovery be. We are seeing further confirmation of the underlying structure resembling the COVID white swan crash which recovered over a period of 8 weeks. In this regard my expectation is unchanged, which is a recovery (back to the $55k-$65k region) over the remaining 4 weeks.
Short term: Short term on-chain indicators are reading neutral to bullish. This forecast is unchanged from previous, given the low to moderate buying power seen via exchange flows, there’s likely another week of consolidation before a bullish move upwards. Meanwhile NVT Signal is grossly oversold, the underlying investment volume should provide decent fundamentals for a push upwards once the resistance band of $42k is broken. Perhaps a week of sideways, then up.
IMPORTANT NOTE:
All forecasts are probabilistic with roughly 80% historical reliability for short time frame forecasts. Longer range forecasts are more reliable due to fundamentals prevailing over the long run, shorter time frames are subject to unpredictable events and the randomness of markets. Short term speculators should use appropriate risk management.

Analysis Breakdown
My last letter came at a time of peak fear in the market, I surmised that a recovery was underway from 3 core metrics:
> 1. user growth of the network confirming the bull market was intact;
> 2. capital moving to stablecoins were at extreme levels typical of a price bottom
> 3. coins being re-accumulated by strong hands following a pattern similar to the COVID recovery
Let’s revisit these touch points to see how the structure has developed in the 15 days since then…
1. Network user growth is increasing
While price has been sideways, the rate of user growth on the network has been very active, continuing to rise higher. This picture dispels fears of a protracted bear market, in bear markets user growth drops off a cliff.

2. Capital in stablecoins flowing back into Bitcoin
The extreme levels of capital that moved into stablecoins (as dry powder awaiting for the right conditions to buy back) is now flowing back into Bitcoin. We have a confirmed bottom in the Stablecoin Ratio Oscillator. The buying has begun.

Stablecoin Ratio Oscillator measures the ratio of Stablecoin to Bitcoin capitalisation in standard deviations above and below its norm. In this metric we used the 200 day moving average as the “normal level”.
3. Coins are being re-accumulated by strong hands
The chart below revisits the flow of coins moving between strong hands (the Rick Astley’s of this world, who buy with minimal history of selling ) and weak hands (speculative holders). Now with two further weeks of data, we can see the structure is very much shaping up like the COVID recovery.

7 day moving average of coins moving between strong and weak hands
Seen in the purple line of the chart above, during the 2019 bear market bottom (1) coins were accumulated slowly by strong hands. Whereas during the COVID crash (2) coins were accumulated at a much faster rate resulting in a much faster recovery.
So far during this present recovery (3) coins are being accumulated at a similarly fast rate as the COVID recovery. This suggests a recovery closer to 6 weeks rather than the 4 months it took during the 2019 bear market bottom (1).
Exchange flows are now bullish
The net flow of coins to and from exchanges have now reverted to bullish.
Lorem ipsum dolor sit amet, at mei dolore tritani repudiandae. In his nemore temporibus consequuntur, vim ad prima vivendum consetetur. Viderer feugiat at pro, mea aperiam
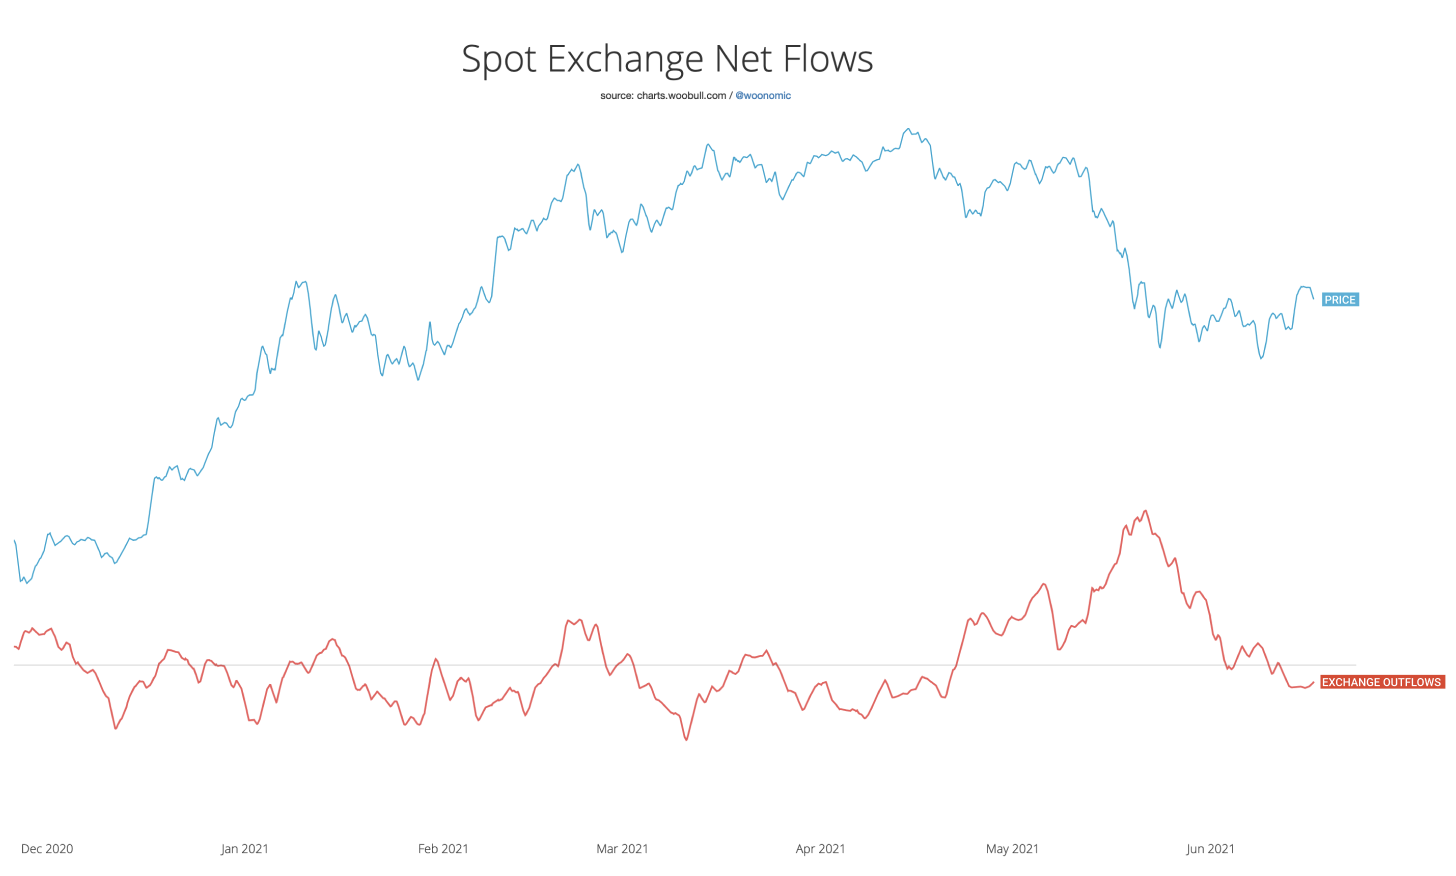
Net flow of BTC into and out of spot exchanges (2 week average). Negative net flows are bullish, signifying coins being bought, moving off exchanges and into cold storage.
While the data is bullish, it’s only mildly so. I suspect there’s a bit more time left on the clock before price is ready to break out from the current sideways consolidation band, perhaps another week.
Investor volumes point to Bitcoin being oversold
I’ll close up this letter delving into the 3 versions my NVT metric, all pointing bullish across many time frames.
NVT Price (which uses economic first principles) puts BTC valuation at $54.5k. Bitcoin is 28% discounted from this estimation of fair value.
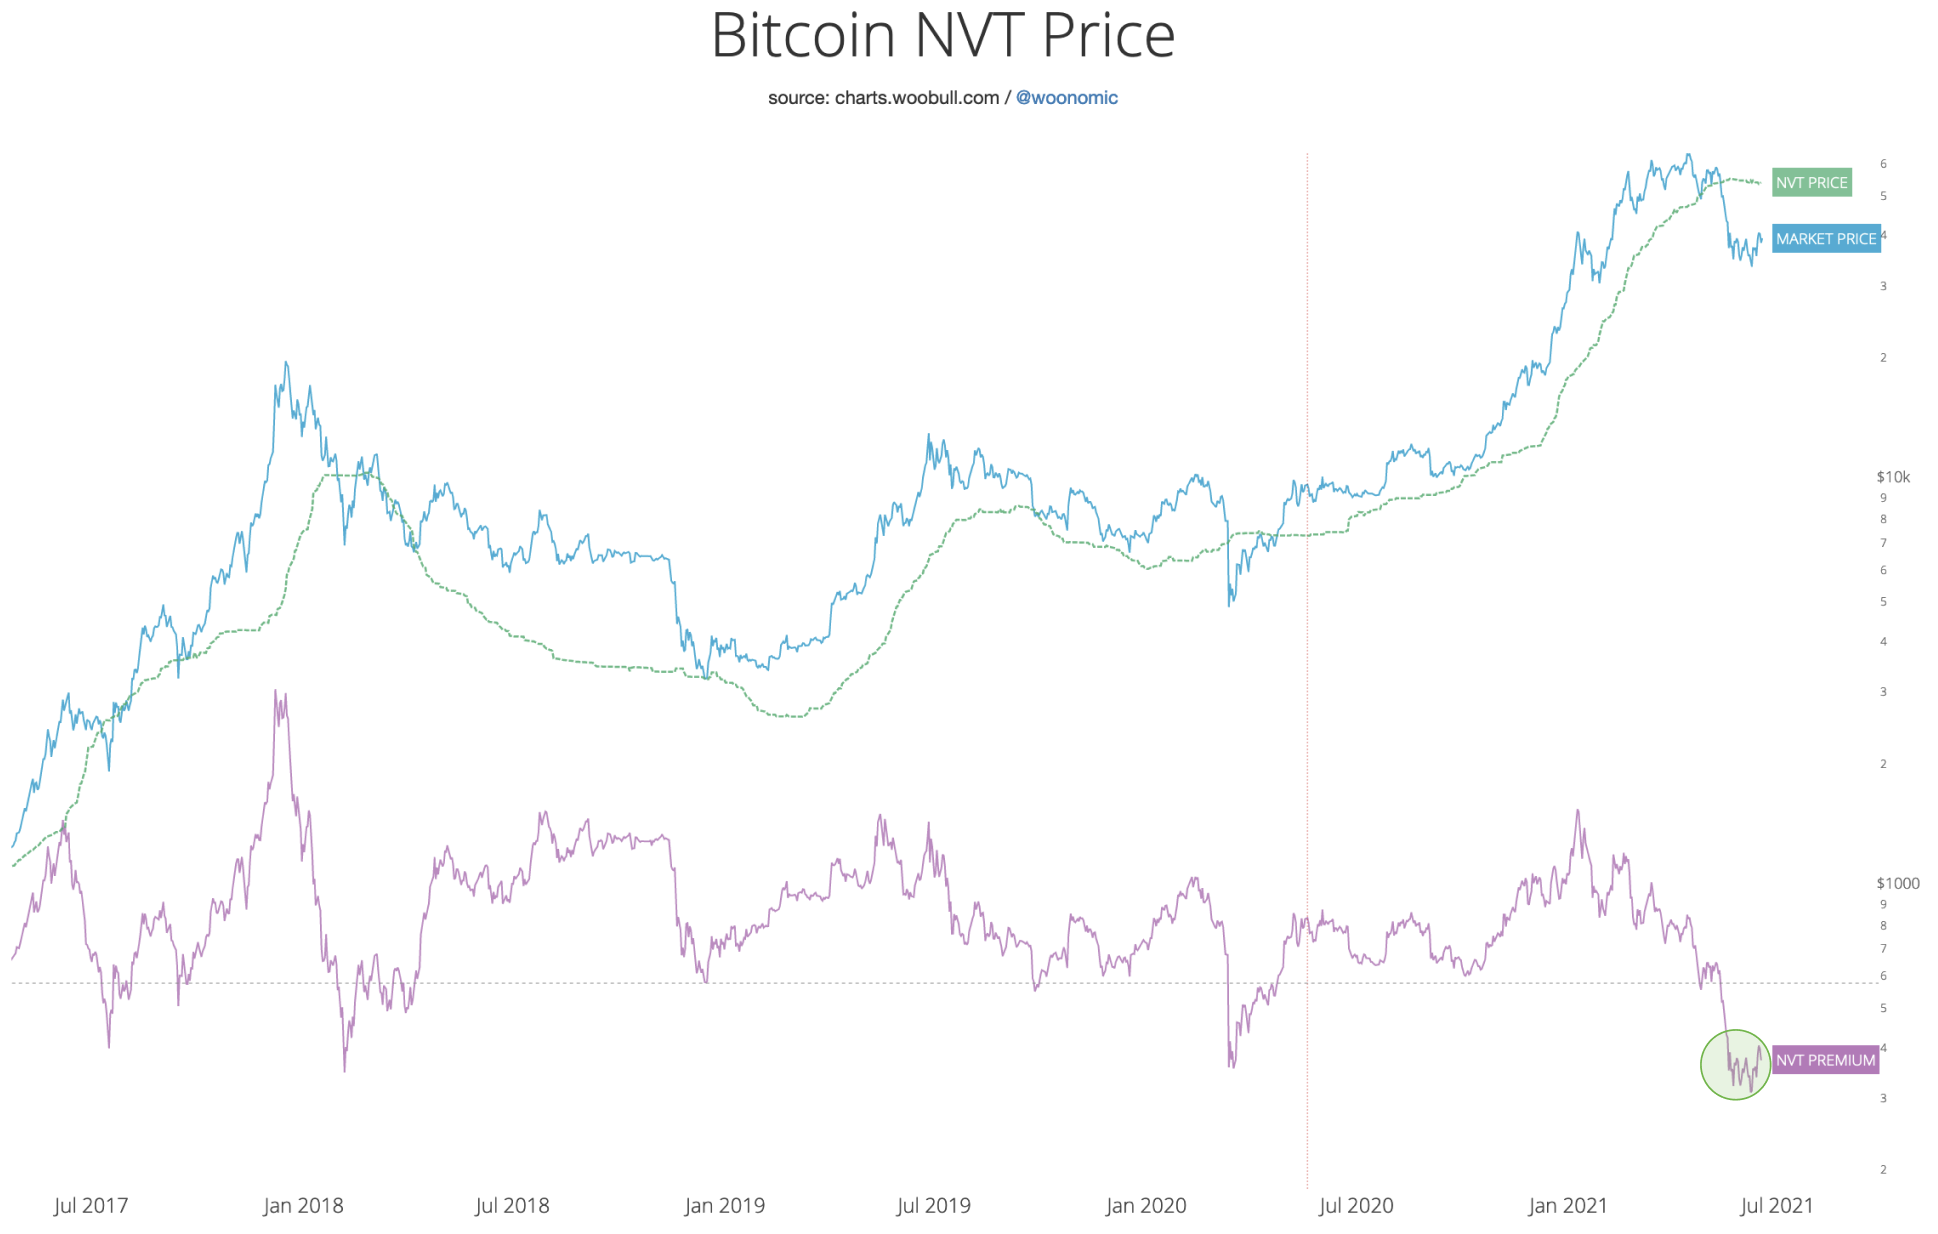
The longer term view can be encapsulated with NVT Ratio, it’s a reliable macro indicator. Currently it’s in a buy zone.

Finally for a shorter term view, we can look at NVT Signal. In this chart below I’ve improved the original NVT Signal to account for shortcomings of the old indicator drifting over time. NVT Signal is currently in a very rare buy zone, last seen at this scale in 2018.

This improved version of NVT Signal corrects for its tendency to drift upwards over time. This drift is caused by the blockchain not seeing some long term investor activity as it moves off-chain as exchange dominance increases. This metric shows NVTS above and below its 2 year moving average measured standard deviations.