Introductory course to become a Trader
This section introduces YOU to the 8 essential elements for a trader or investor to know.
Note: You don’t need to register with an account as this section is open to the public hence free access.
(Click on each row to expand and start)
TERMINOLOGY AND DEFINITIONS
Every industry, be it manufacturing, IT, medicine, sport or hobby have its own terminology. Trading is no different. Here we have a section dedicated to common trading terminology, along with a full comprehensive glossary page.
TRADER’S CODE
A guide to having discipline in trading.
❌ Don’t engage in revenge trading.
Build a trading plan. Be consistent.
✅ Execute only planned trades with good risk to reward ratio. Stick to your plan.
— Wim Hof, Becoming the Iceman: Pushing Past Perceived Limits
Journal and review all of your trades.
✅ Keep a consistent journaling time to build the habit.
Always be a student of the game!
Trader’s code
A guide to having discipline in trading.
FACT: 95% of traders lose money as they lack discipline to sticking to their trading strategies or lack of. Discipline or emotions directly influence your decision making process. Its what separates consistency profitable
traders.
Here are 7 lessons to master your discipline.
Reflect on your emotions. Be self aware.
– Take time on recognising and acknowledging your feelings. What you feel is valid;
– Assess potential triggers for impulsive actions. Define and accept triggers. Eg making money to pay bills or recover losses;
– Be kind to yourself and show empathy in hard times. Never belittle yourself. Go back and learn why you made a mistake;
✅ Keep a trading-thought journal. This is worth it as you can look back with that trade.
❌ Don’t beat yourself up for losing the trade/s as its inevitable. But learn from your mistakes.
Embody market awareness. Eliminate confirmation bias.
– Refresh your bias each day based on new data. New day = new plan;
– Stay objective and adapt to dynamic markets. Adapt or fail;
– Update your trading plans as new information becomes available;
✅Check scheduled news events daily; be aware of potential volatility.
✅ Reduce your risk ahead of high impact events.
Establish strict trading rules; Define your non negotiable.
– Consider setting a daily loss limit. Eg. Use a daily stop of $550 per account;
– If you lose more than this, know that something has gone wrong in your approach;
– Pick a position size with appropriate risk & stick to it;
– Only increase size after 2 consecutive winning weeks;
– No plan = no trade. Avoid trading if you haven’t planned the scenario’s as you end up in ‘no man’s land’;
❌ Don’t engage in revenge trading.
❌ Don’t have a catchup “trying to make it back” mindset.
Build a trading plan. Be consistent.
– Outline the market context & your key levels each morning;
– Write out your trading plans & keep them handy at your trading station;
– Be prepared to trade In the Zone from 8:30am – 12:30pm NY time;
✅ Execute only planned trades with good risk to reward ratio. Stick to your plan.
❌ Don’t: Increase risk by moving your stop loss. Once you choose an invalidation point, it must be honoured.
Implement a shot-clock after losing trades.
– Take 5-minutes or more to cool-off after a losing trade or series of trades;
– Use this time to journal, plan trades, meditate or use the restroom;
– Implement breath-work to increase blood flow to your brain;
“In the Bhagavad Gita they say, “The mind under control is your best friend, the mind wandering about is your worst enemy.” Make it your best friend, to the point where you can rely on it. Your mind makes you strong from within. It is your wise companion. The sacrifices you make will be rewarded.”
— Wim Hof, Becoming the Iceman: Pushing Past Perceived Limits
Journal and review all of your trades.
– Keep a log of thoughts, emotions, data during trades. Refer back to these notes and highlight any salient points;
– Screen record all your trades & watch the game film daily. This is a low cost way to capture all of your trading action;
– Conduct daily, weekly and monthly trade reviews. Be honest and patient with yourself;
✅ Keep a consistent journaling time to build the habit.
❌ Don’t journal only winners. Losses are highly valuable lessons.
Always be a student of the game!
– Be humble & strive to learn continuously;
– Find a mentor, someone who is willing to teach you;
– Read for 30-minutes per day to keep your mind sharp;
– Keep an open mind & always be adaptable;
✅ Find a good trading community (we have a list of twitter accounts, youtube channels and paid subscriptions even though we are confident in our stuff for we can always benefit from others).
❌ Try not to stress and don’t suffer in silence.
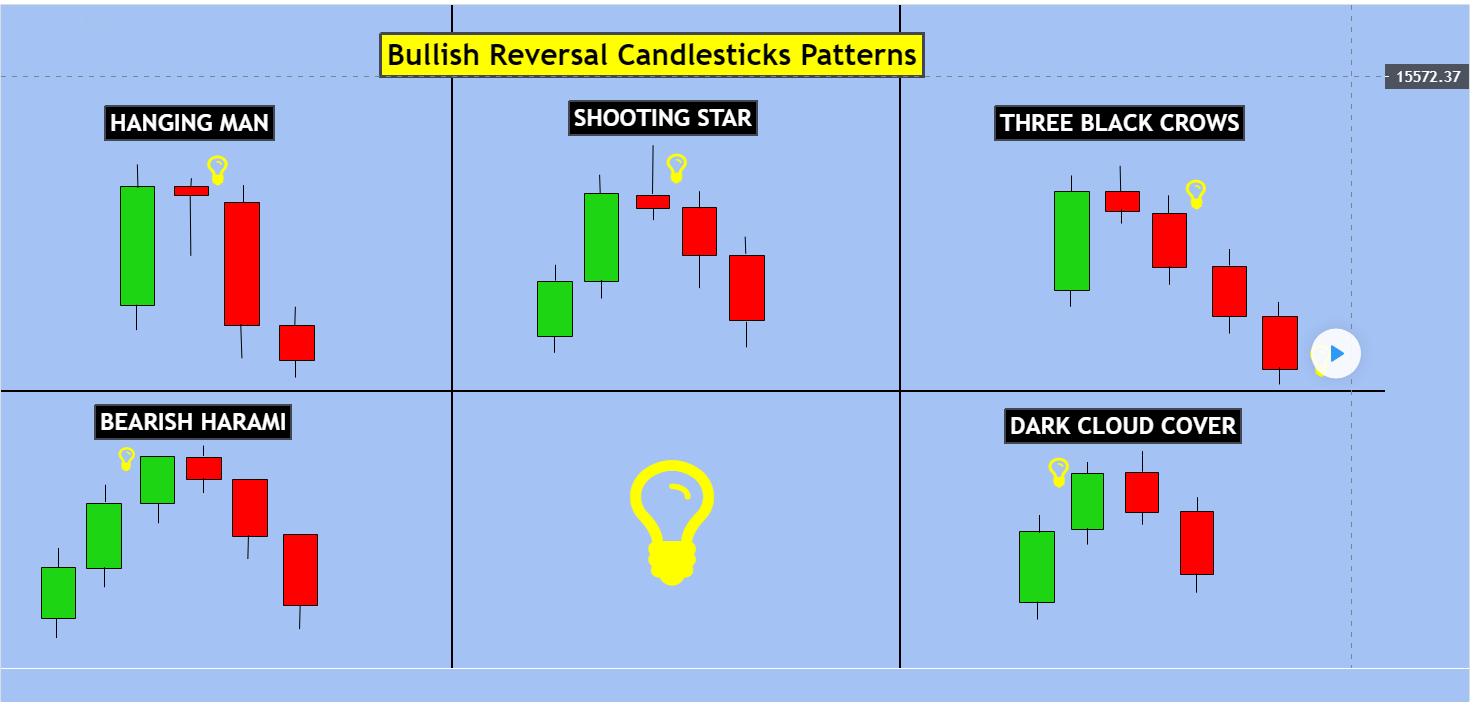
1) CANDLE STICKS
What are “Candle Sticks”
A candle stick represents price action within a time frame. In essence it a method to represent price behaviour and by creating symbols of price behaviour, we can extract some information of a period of time.
Candle sticks Introduction
What are “Candle Sticks”
A candle stick represents price action within a time frame. In essence it a method to represent price behaviour and by creating symbols of price behaviour, we can extract some information of a period of time.
The makeup of a candle stick:
> The candle sticks body represents the price that it started and the price it ended within a particular time frame.
> The wicks of a candle stick represent what happened to price during a period. It shows you the range of the price action during that time.
To learn more, click on the blue button below
2) SUPPORT AND RESISTANCE LEVELS
Support and resistance levels are critical concepts in technical analysis used by traders to identify potential price levels where the price of an asset is likely to encounter obstacles or reverse its current direction. These
levels are based on the idea that markets tend to remember previous price levels and react to them in the future.

Support and Resistance Introduction
Support and resistance levels are critical concepts in technical analysis used by traders to identify potential price levels where the price of an asset is likely to encounter obstacles or reverse its current direction. These
levels are based on the idea that markets tend to remember previous price levels and react to them in the future.
The significance of support and resistance levels lies in the fact that they can act as turning points for the price. If a support level holds, it suggests that buying pressure is strong enough to push the price higher. Conversely,
if a resistance level holds, it indicates that selling pressure is sufficient to prevent the price from rising further.
Traders often use support and resistance levels to make trading decisions.
3) THE TREND
In trading, trends refer to the general direction in which the price of an asset is moving over a period of time. Identifying and understanding trends is crucial for traders as it helps them make informed decisions about when
to enter, exit, or stay out of the market. There are 3 main types of trends in trading. Uptrend, downtrend and range bound which is no trend.
Trend Introduction
In trading, trends refer to the general direction in which the price of an asset is moving over a period of time. Identifying and understanding trends is crucial for traders as it helps them make informed decisions about when
to enter, exit, or stay out of the market. There are 3 main types of trends in trading. Uptrend, downtrend and range bound which is no trend.
To learn more, click on the button below.
4) MOVING AVERAGES
Moving averages help traders identify the general direction of a trend and smoothen out the noise in the price data, making it easier to identify potential entry and exit points for trades.
Moving Averages Introduction
A moving average (MA) is a popular technical analysis tool used in trading and finance to smooth out price data over a specified period and identify trends. It is a lagging indicator, meaning it relies on past price data to calculate its value. The moving average is calculated by adding up the prices of an asset (such as a stock or currency) over a certain number of periods and then dividing the sum by the number of periods.
For example, if you want to calculate a simple moving average (SMA) for a stock’s closing prices over the last 5 days, you would add the closing prices of the last 5 days and divide the sum by 5.
Moving averages help traders identify the general direction of a trend and smoothen out the noise in the price data, making it easier to identify potential entry and exit points for trades.
To learn more about what MA we use and how, click on the blue button below
5) FIBONACCI LEVELS
This series will reveal the full power of Fibonacci being applied to your analysis, study this without distraction, put it into practice, and see for yourself.
Fibonacci Introduction
Fibonacci sequence and the golden ratio exist everywhere in trading. We will look at how to apply them. We can use the Fibonacci Retracement tool to highlight price areas with strong significance in both uptrends and downtrends, on both HTF and LTF .
It can provide a trader with great confluence to identify a strong trade entry or take profit.
Fibonacci Retracement is a must-have in your confluence toolset.
This series will reveal the full power of Fibonacci being applied to your analysis, study this without distraction, put it into practice, and see for yourself.
6) DIVERGENCE / CONVERGENCE
Divergence is one of the most effective indicators when used well and is the most common market conditions indicator that provides a reliable trading signal for a reversal. However its also fought with risk as well.
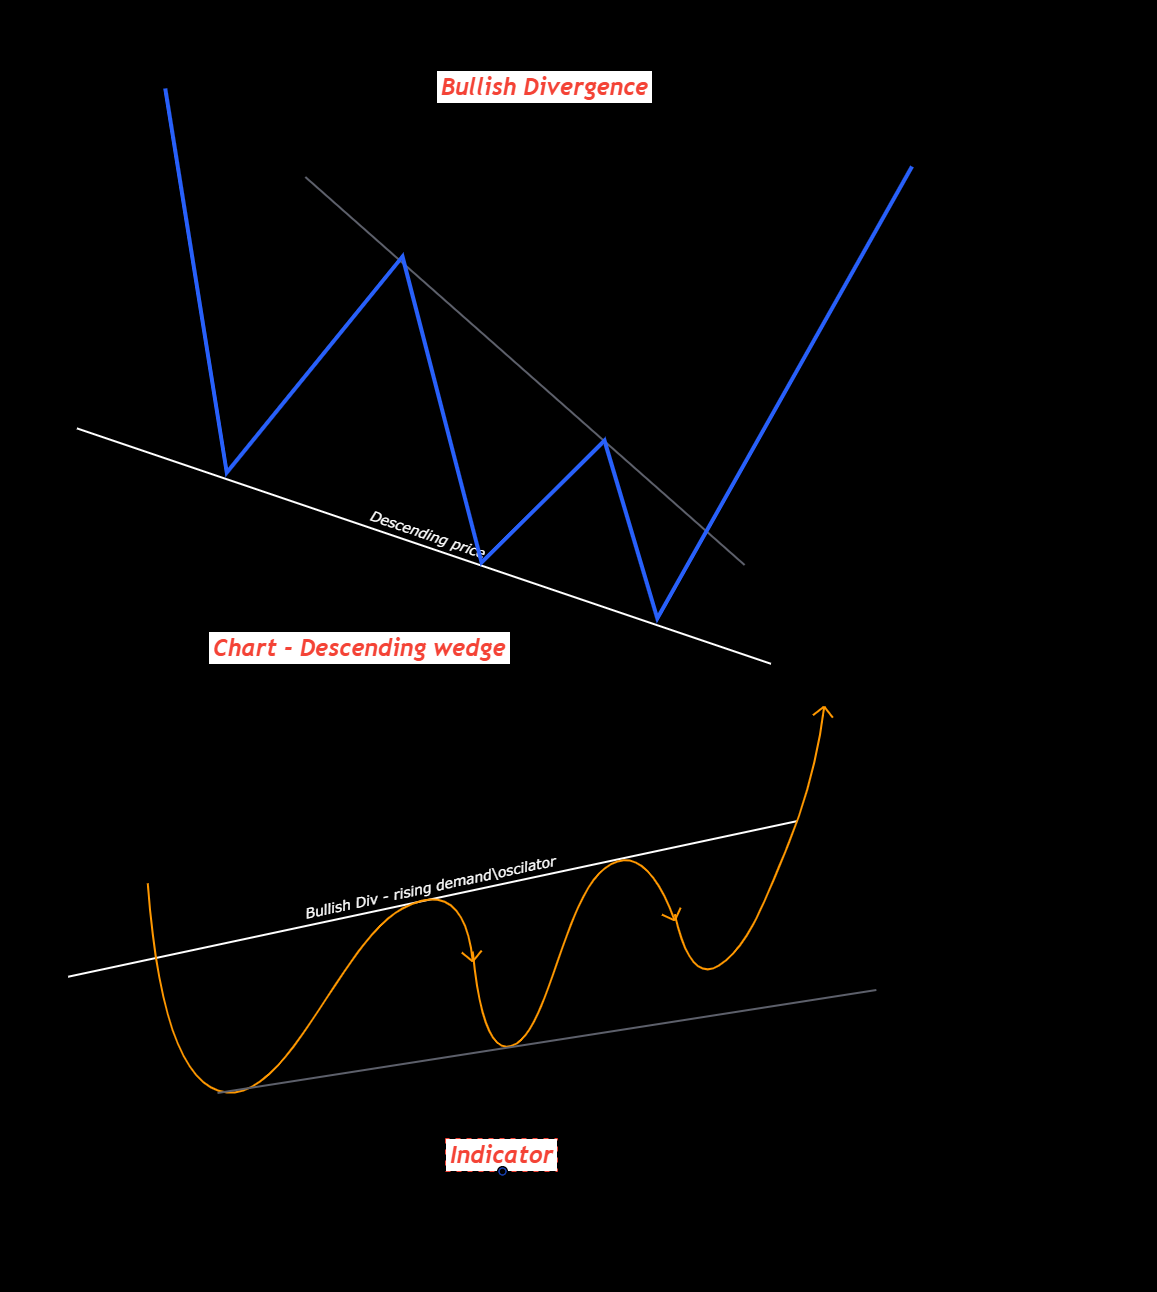
Divergence Introduction
Divergence is one of the most effective indicators when used well and is the most common market conditions indicator that provides a reliable trading signal for a reversal. However its also fought with risk as well.
The concept is simple and that’s why its like by traders all over. The signal of the upcoming price moment appears from this divergence. The indicator can only notify you of over bought or oversold or exhaustion conditions
on the horizon using a oscillator type of indicator, Convergence is another.
To learn more about Divergence or Convergence, click on the button below.
7) ELLIOT WAVES
Mandatory Subject as its the basis for all charts and trading.
Elliot wave Introduction
Mandatory Subject as its the basis for all charts and trading.
Elliott Wave Theory was developed by Ralph Nelson Elliott in the 1920s. Its a theory based on observation of the financial markets with characteristic movements that repeat. Hence he called these movements “waves” due to
the highs and lows and cyclical up and down motion. In total there are 13 major Elliott wave patterns. Here we will only provide an introduction, enough for you to understand and for you to take it further.
8) INDICATORS
This section is all about indictors and how they can be used. This is a basic introductory module for the popular indicators like the MACD, RSI, etc
The relative strength index (RSI) is a momentum indicator that measures the magnitude of recent price changes to evaluate overbought or oversold conditions in the price of a stock or other asset;
Indicators Introduction
This section is all about indictors and how they can be used. This is a basic introductory module for the popular indicators like the MACD, RSI, etc
The moving average convergence divergence (MACD) is a trend-following momentum indicator that shows the relationship between two moving averages (ema) of a price action. The MACD is calculated by subtracting the 26-period
exponential moving average (EMA) from the 12-period EMA. The result of that calculation is the MACD line.
The relative strength index (RSI) is a momentum indicator that measures the magnitude of recent price changes to evaluate overbought or oversold conditions in the price of a stock or other asset;
The RSI is displayed as an oscillator (a line graph that moves between two extremes) and can have a reading from 0 to 100. An example is given below;
9) LIQUIDITY
The word “liquidity” is used a lot in trading and there is a reason for it, its part and parcel of the trading environment and its real. Therefore it makes sense that you understand this factor and adopt into your chart
analysis and into your trading strategy.
Liquidity Introduction
The word “liquidity” is used a lot in trading and there is a reason for it, its part and parcel of the trading environment and its real. Therefore it makes sense that you understand this factor and adopt into your chart
analysis and into your trading strategy.
So what is Liquidity in general terms and what is it when it comes to actual trades ?
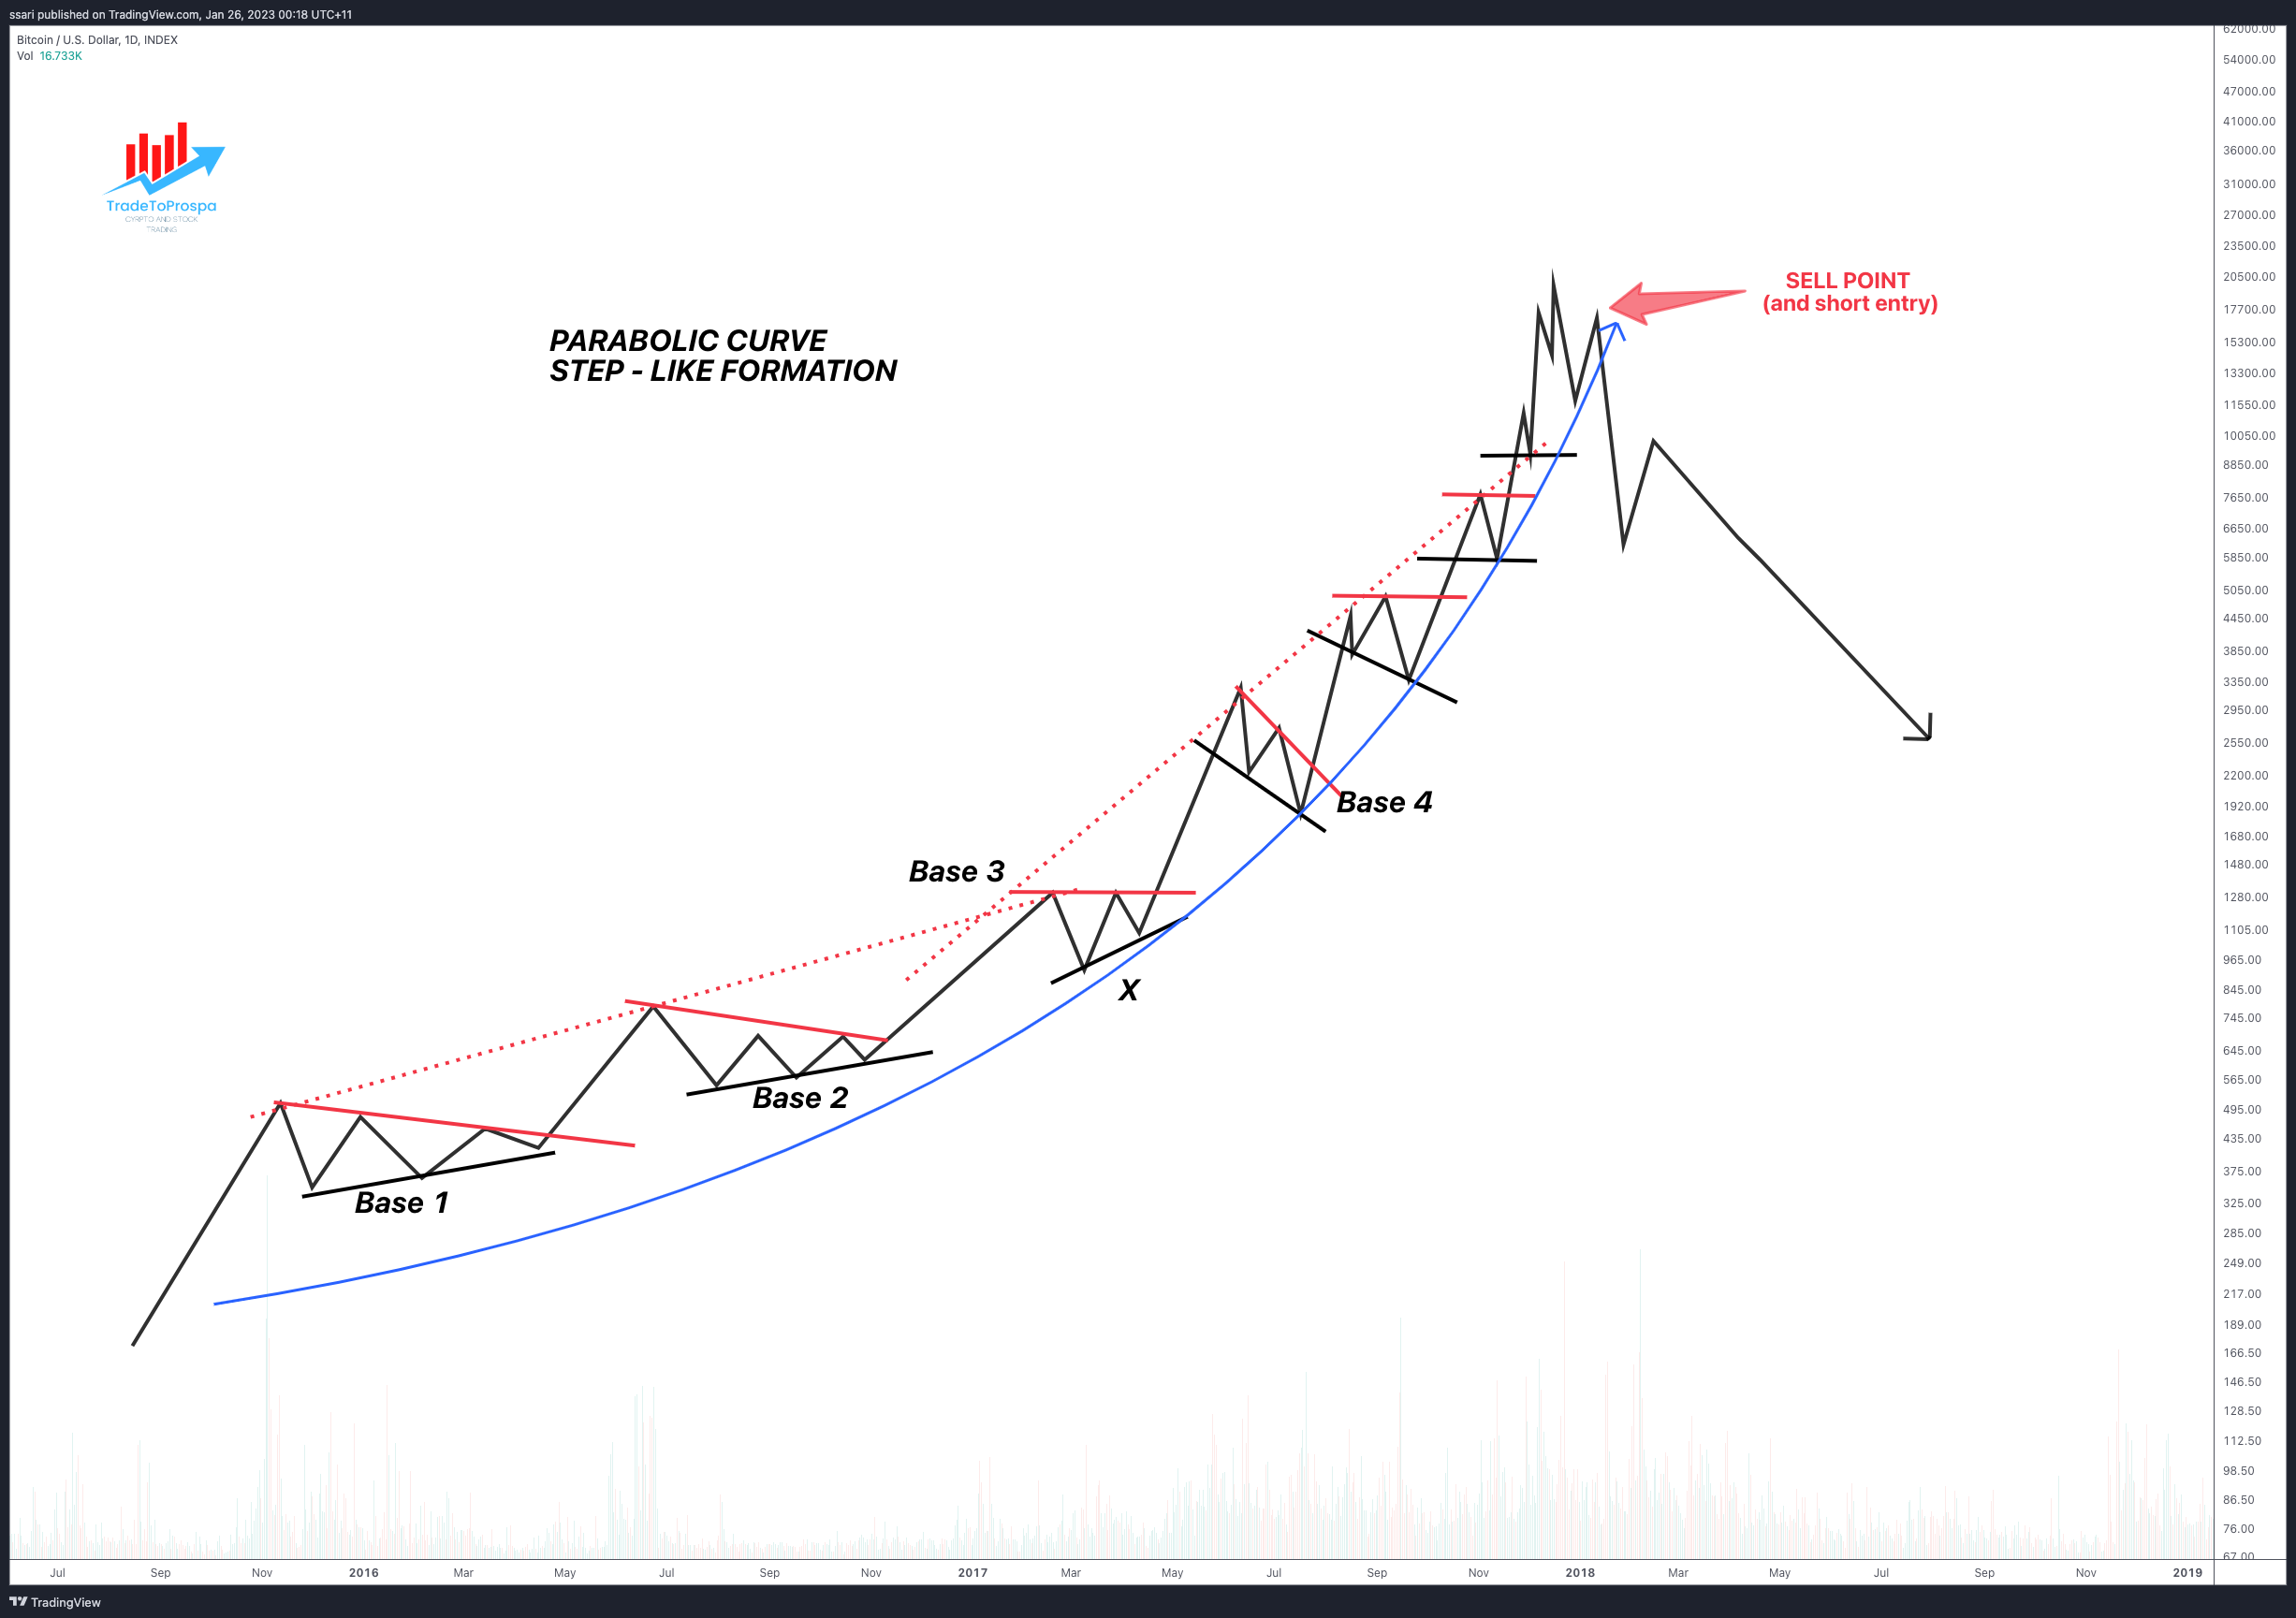
10) PRICE CYCLES

What is Wyckoff
When one talks about price cycles in trading context, one has to involve Elliot Wave Theory, Dow Theory, Gann Theory and Wyckoff Theory, Also the likes of Jesse Livermore and Stan Weinstein are known for their contribution to technical analysis as well.

11) CONSOLIDATION
When sellers get exhausted, then demand general starts getting higher and it’s then when price breaks the resistance level.
Consolidation Introduction
When sellers get exhausted, then demand general starts getting higher and it’s then when price breaks the resistance level.
When price consolidates, meaning rests sideways under resistance, this is seen as bullish. There are only so many times those who short or sell, especially in a macro uptrend that eventually, the high lows gives a breakout.
At times it can be a reversal, Hence one must always look at the pros and cons of each position (is it a bullish or bearish trend or market), as it could be the decider and also a low risk short at times. this is where liquidity
levels come in.
12) HARMONICS
After covering the Fibonacci retracement and Fibonacci extension tool, then by combining them with levels, we can observe “Harmonic” patterns.
Harmonics Introduction
After covering the Fibonacci retracement and Fibonacci extension tool, then by combining them with levels, we can observe “Harmonic” patterns.
Harmonic patterns cannot be used on their own with fibonacci levels, even if they align correctly. What we need is context as well as symmetry between the waves. For example, AB wave should not move 20% in 1 hour and then
wave CD 20% in 20 days. Time and symmetry are important factors when we look at trading these patterns as well.
Never trade harmonics with patterns alone, you need to look for confluence with other chart elements. What are these chart elements, well they are listed above. The trick is to look for certain confluences and possibly
align them with a strategy of some sort.
Soon to be release here
APPRENTICE LEVEL
This section is all about Risk Management, TradingView, other tools, Trading Position Size, Trading with Leverage and managing expectations.
This section is all about Risk Management, TradingView, other tools, Trading Position Size, Trading with Leverage and managing expectations.
Note: The above 8 elements are part of the curriculum to being an apprentice or trader including this module.
5 x Videos to be available here, soon.
Soon to be release here
MISCELLANEOUS
This section is all about topics that broaden your mind on what is actually out there and reality. Being a trader means you need to know what really is taking place so you can make better decisions.